
There probably is an air of excitement among U.S. housing bulls – particularly the technically oriented ones. Sales of both new and existing homes have broken out of recent ranges.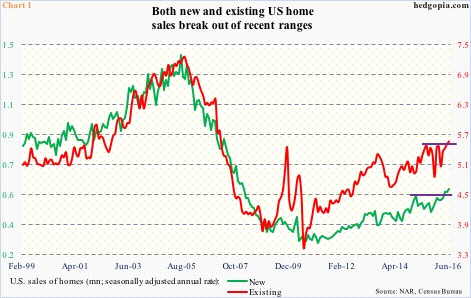
In June, new homes rose 3.5 percent month-over-month to a seasonally adjusted annual rate of 592,000 units – the highest since February 2008; existing was up 1.1 percent m/m to 5.57 million units (SAAR) – the highest since February 2007 (Chart 1). Having been sideways for about a year before breaking out, the question is, is the breakout genuine or false? There are reasons to believe it could be the latter.
The biggest tailwind continues to be interest rates. The 30-year fixed mortgage rate is around 3.5 percent currently. In 2006/2007, right before the bubble burst, it was north of six percent. This helps, particularly when wage/income growth has stalled.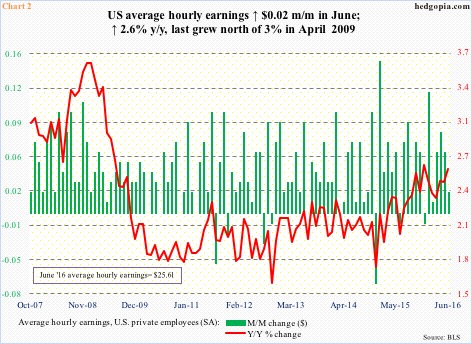
In June, private-sector average hourly earnings grew a couple of pennies m/m, and 2.6 percent year-over-year, to $25.61 (Chart 2). The y/y growth rate was the fastest since last December, but nothing to speak of in a larger scheme of things. Wage growth is suppressed versus prior cycles. The last time wages grew with a three handle annually was in April 2009.
In a labor versus corporate tug of war, at present the former is at the receiving end. It is a buyer’s market, not seller’s. Hence suppressed wages. Job growth otherwise has been decent, though weaker than in prior cycles.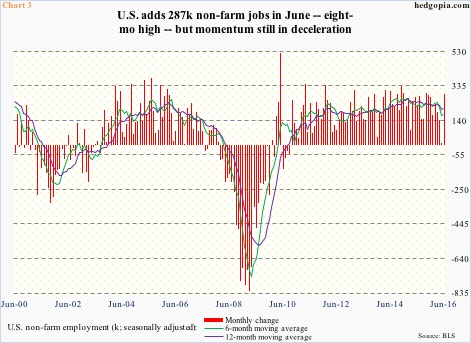
Year-to-June, non-farm payroll has averaged a monthly addition of 172,000. This would have been much lower if not for the eight-month-high 287,000 in June. This compares with an average of 229,000 in 2015 and 251,000 in 2014.
From this standpoint, payroll momentum of late is in deceleration, with the six-month average below 12-month in 12 of last 16 months (Chart 3).
That said, however anaemic, job growth has helped expand households. Household formation pretty much went sideways in the 115-million range for two years through August 2014, before rising. For a year through March this year, it has once again been stuck at north of 117 million.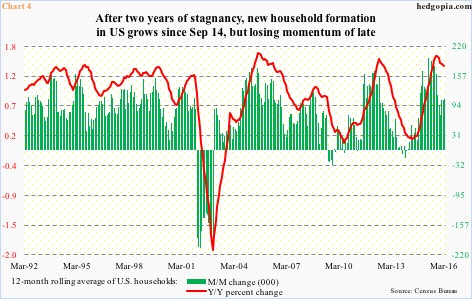
Chart 4 calculates a 12-month moving average of households, and, as is evident, the trend – both m/m and y/y – is down. This is an important data point for home sales. Now, the data is as of March, hence three months old. Too soon to tell if there has been an uptick in household formation, thus resulting in a recent spurt of sales. But if Chart 4 does not see improvement, odds grow what we see in Chart 1 is a fake-out, not a breakout.
Here is a relevant data point. The share of first-time buyers (existing homes) was 33 percent in June, up from 30 percent m/m and y/y. This was the highest since July 2012, when it stood at 34 percent. The higher this metric, the healthier the market.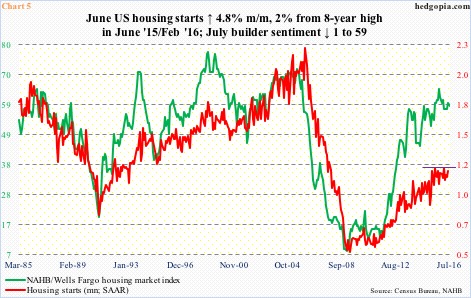
Is this the reason why builders continue to show hesitancy in putting their money where their mouth is? In June, housing starts rose 4.8 percent m/m to 1.19 million units (SAAR). They recently peaked at 1.21 million units in February – the highest since October 2007 – and have gone sideways for over a year. Builder sentiment, on the other hand, remains elevated, at least historically (Chart 5). In the past, whenever the gap between the two lines widen, it is the green line that tends to come under pressure to meet the red.
Enter China. In the 12 months through March, as per an annual National Association of Realtors report, sales to Chinese buyers fell for the first time since 2011, to $27.3 billion from $28.6 billion a year ago. They bought 29,195 units, down from 34,327. This has been an important source of demand for U.S. housing, and can least afford to cool off. However, capital-control measures are getting tighter in China.
Combine all this, and the risk of a fake-out in Chart 1 is high.
Thanks for reading!
