
September-quarter buybacks by S&P 500 companies were decent, but the four-quarter total is on a decelerating trend. These companies will probably get an opportunity to buy their shares at a cheaper price next quarter. Investor sentiment is too complacent and smells of herd mentality.
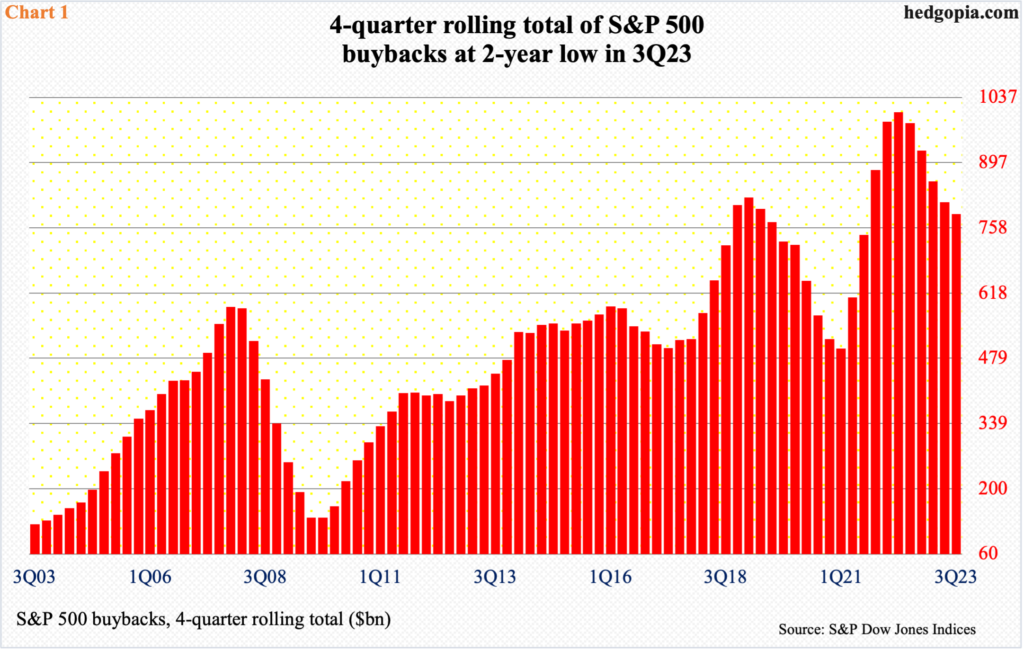
The S&P 500 Large Cap Index declined 3.6 percent in the September quarter. The boardrooms of the constituent companies did not seem interested in aggressively taking advantage of this selloff. They spent $185.6 billion in buying back their own shares during the quarter. This was up from $174.9 billion in the June quarter, but nothing major.
The record high $281 billion was set in 1Q22, when the S&P 500 dropped 4.9 percent and was down as much as 12.8 percent at the lows. Last quarter, the index was down 4.8 percent at the lows. Maybe this was not deep enough to entice the corporate C-suite into aggressively buying back. Or maybe the 1Q22 pace was not on a sustained path.
On a four-quarter rolling total basis, 3Q23 buybacks came in at $787.3 billion, which is a lot of money, yet it is trending lower. In this timeframe, buybacks peaked at $1,005.4 billion in 2Q22 (Chart 1).
For equity bulls, buybacks continue to make up a tailwind, no doubt, but the pace is decelerating. In the four quarters through the September quarter last year, S&P 500 companies spent $981.6 billion.
With five sessions of trading left for the December quarter, the S&P 500 is up a massive 10.7 percent. This has pushed up investor sentiment into complacency. The way things are going, these companies should get an opportunity to buy their shares at a lower price in the next quarter.
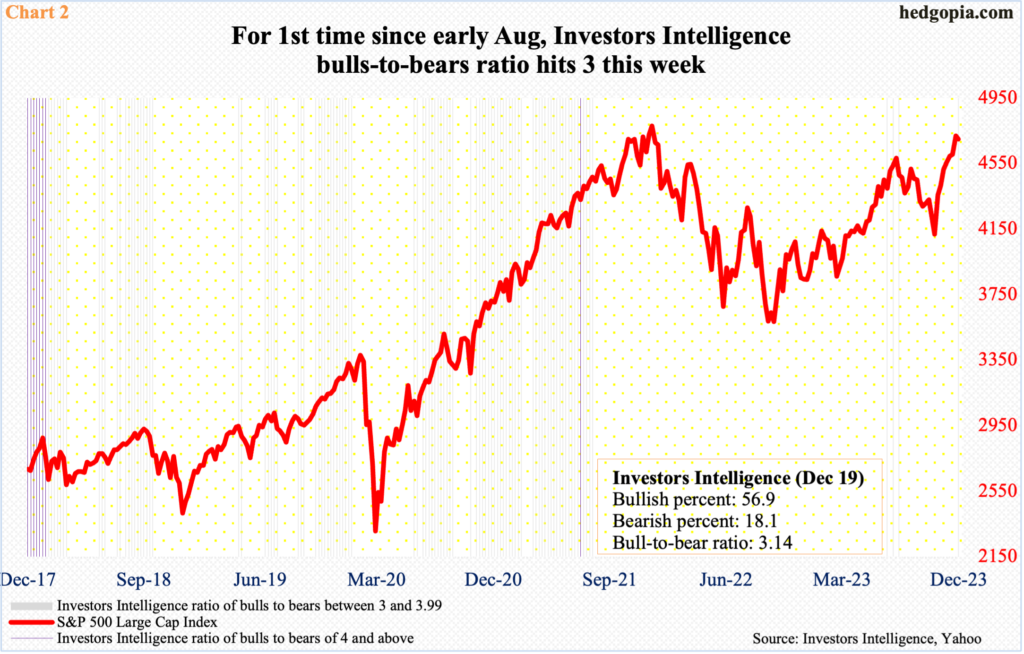
This week, the Investors Intelligence bullish percent increased 1.3 percentage points week-over-week to 56.9 percent, even as the bearish count decreased 1.3 percentage points to 18.1 percent, for a ratio of 3.1.
With only one week remaining this year, there have only been four weeks in which the ratio took up the three handle (Chart 2). The prior three took place in July and August this year. Back then, the first reading occurred in the week to July 4th, followed by the second in the week to 18th and the third in the week to August 1st. The S&P 500, rallying hard from the October 2022 trough of 3492, peaked on July 27th at 4607, before shedding just under 11 percent in the next three months, bottoming at 4104 on October 27th. Near that low (in the week to October 31st), bulls were 42.9 percent and bears 25.7 percent. This week, bulls were 56.9 percent and bears 18.1 percent, with the former at a 20-week high and the latter at a 22-week low. In the meantime, the S&P 500 at 4747 has surpassed the July high and is not that far away from its record high of 4819 posted in January last year.
By the way, the last time a ratio of four formed was in July 2021. Even three has not been that common. This week’s reading has the potential to have shown up at a crucial spot.
Sentiment is giddy, to say the least.
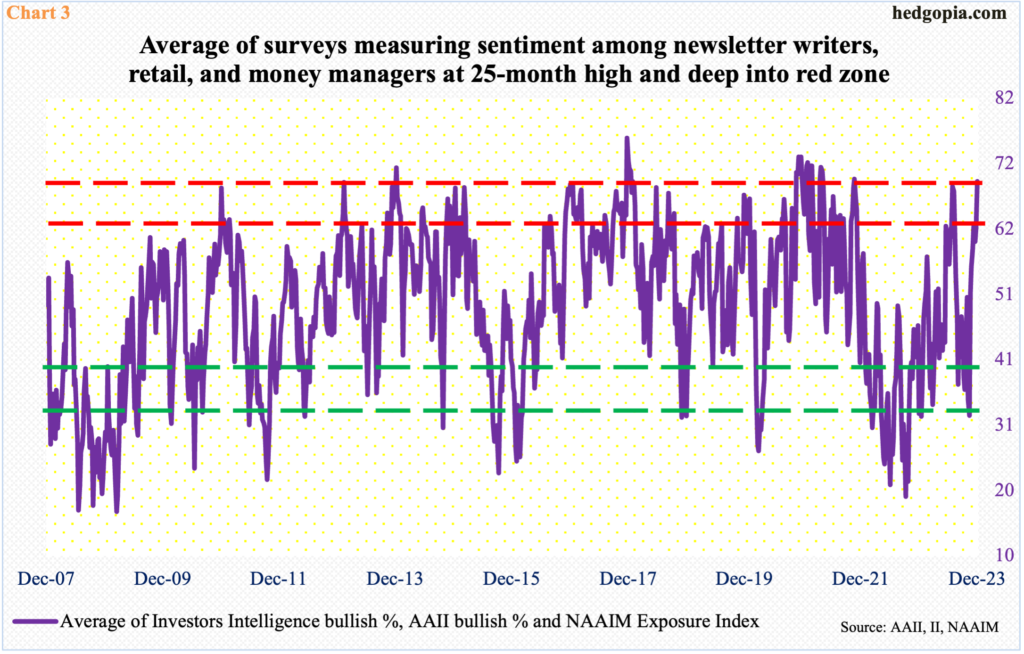
Chart 3 combines three different surveys and takes out an average measuring the three diverse groups. Investors Intelligence is a survey of newsletter writers, who cater to paying subscribers. The American Association of Individual Investors surveys its members, so it represents a good reflection on individual mood. And the NAAIM Exposure Index surveys how money managers are positioned, with the index measuring National Association of Active Investment Managers members’ average exposure to US stock markets.
In the week to Tuesday, as stated earlier, Investors Intelligence bulls hit 56.9 percent – a 20-week high. In the week to Thursday, AAII bulls reached 52.9 percent, which is the highest count since April 2021. And in the week to Wednesday, the NAAIM index rose to 97.3, which represents the highest reading since the last week of July this year. The average of the three comes to 69, which has not been this high in the past 25 months. This is deep red territory, and, if past is prelude, a caution is warranted.
Thanks for reading!
