
Small-business optimism remains near multi-decade highs. Small-cap stocks do not quite share this optimism.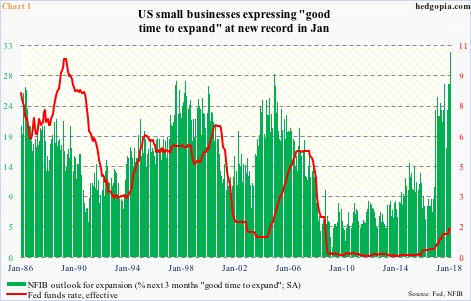
The NFIB optimism index rose two points month-over-month in January to 106.9, just a hair’s breadth away from November’s 107.5, which was a 34-year high. Optimism surged post-presidential election in November 2016, and has stayed there. In October that year, the index read 94.9.
Even more interesting, the survey respondents’ outlook for expansion has never been better. In January, the “good time to expand” component jumped five points m/m to 32 – a new record. As with the main index, it too began to strengthen post-election. In September 2016, it was merely seven (Chart 1).
Side note: the strength in small-business optimism may give the Fed cover to continue hiking.
The latest surge in January came after the Tax Cuts and Jobs Act of 2017 was signed into law last December. Along with cutting regulations and increasing infrastructure spending, tax cuts was one of President Trump’s signature campaign promises.
Small businesses inherently are domestically focused, hence the widely held perception – rightly or wrongly – that they benefit more from cuts in taxes and regulations than their large-cap brethren.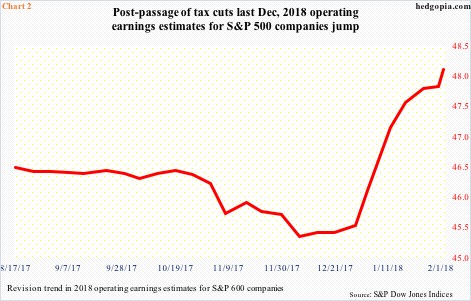
This is getting reflected in earnings estimates.
As of last Friday, the sell-side expected S&P 600 small-cap companies to earn $48.10 out of operations this year. Estimates bottomed on December 7th at $45.34, and since have persistently risen (Chart 2).
For reference, with 4Q still being reported, 2017 is on pace to earn $32.85; 2016 earned $25.60, 2015 $19.66, and 2014 $26.79. Meaning if estimates come through, earnings would have jumped north of 46 percent this year, following a rise of 28 percent last year and 30 percent before that.
Small-cap stocks beg to differ, or at least do not share this optimism right at this moment. Either investors do not expect 2018 estimates to be met or have concluded that this is just one time, or that it is in the price already.
Post-election through the all-time high of 1615.52 on January 24th, the Russell 2000 small cap index rallied north of 35 percent, before coming under pressure. Then, from that high through the intraday low of 1436.43 on the 9th this month, it lost 11 percent.
In the recent sell-off, stocks sold off across the board – large-caps, mid-caps, small-caps, and what have you. But small-caps hit the wall the hardest.
In January, the Russell 2000 only rose 2.6 percent. In contrast, the S&P 500 large cap index increased 5.6 percent, and the Nasdaq composite 7.4 percent.
Of major U.S. indices, the Russell 2000 was also the first to test the 200-day moving average. In fact, intraday on the 9th, it lost that average, but only to see it recaptured by close. Currently, it is trapped between the 50- and 200-day. The former is now dropping, and the latter flattish. Even before the 50-day, there is resistance at 1515. Bulls have their work cut out.
The point is, small-cap stocks are not telegraphing the kind of optimism expressed in the NFIB survey. A survey is just that – a survey. It is one thing to sound optimistic in a survey and another to translate that into revenues and jobs. Right here and now, small-cap stocks are not that hopeful.
Thanks for reading!
