
In a matter of three weeks last month, the S&P 500 gave back 12.4 percent. A .618 golden ratio of that decline lies at 4591, which was tested on February 2 and again on Wednesday. The 50-day lies just above that. Shorts could get tempted here.
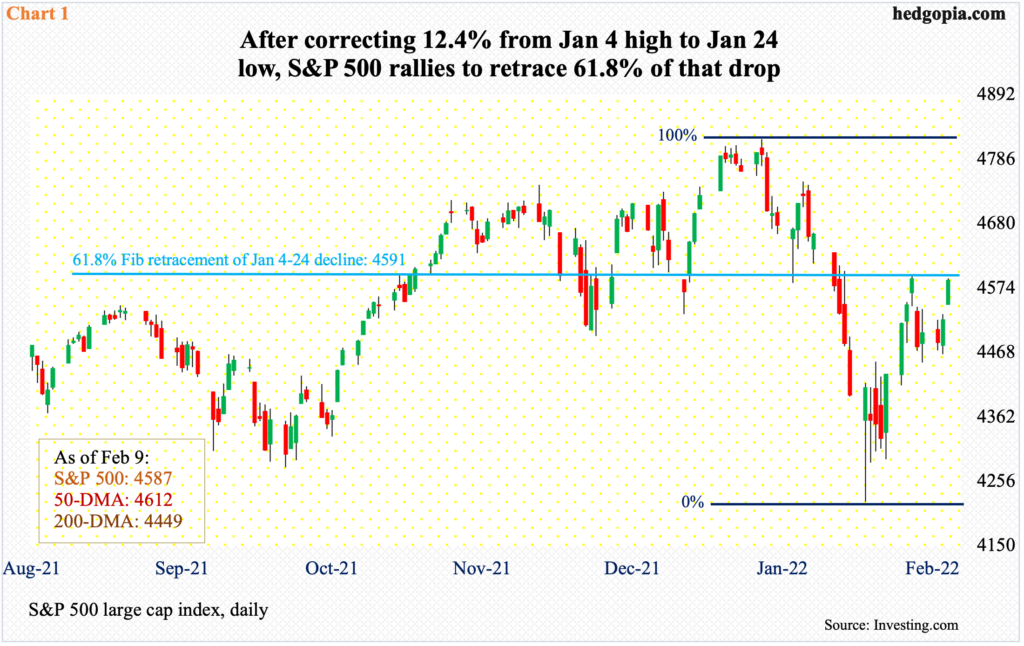
On January 4, the S&P 500 hit 4819 before reversing lower. Soon, it breached both the 50- and 200-day moving averages as well as support zones such as 4540s. By the 24th, the large cap index was down 12.4 percent, tagging 4223 intraday but closing the session strong with a massive hammer reversal. From that low, it then rallied 8.8 percent in the next seven sessions, with the February 2 high of 4595 drawing sellers.
A 61.8-percent Fibonacci retracement of last month’s decline lies at 4591 (Chart 1). The technically oriented ones pay close attention to this golden ratio. The subsequent drop found support at the 200-day on the 4th, which laid the foundation for this week’s rally. Wednesday’s 1.4-percent jump once again put the index right at the Fibonacci resistance. The 50-day is right above at 4612.
Odds favor shorts get tempted to get active here.
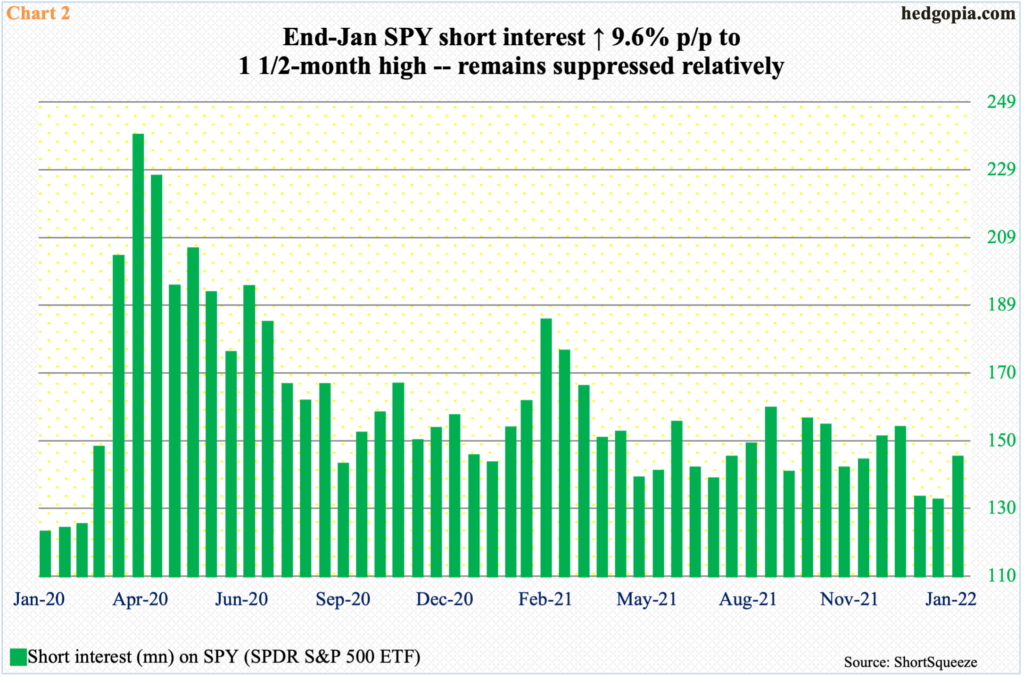
Interestingly, short interest on SPY (SPDR S&P 500 ETF) was up 9.6 percent period-over-period in the second half of January but from a very suppressed level. The mid-January reading of 131.1 million was the lowest since mid-February 2020, when 124 million shares were short. Back then, in the next month and a half, short interest surged to 238.2 million, which ended up helping the bulls as shorts got squeezed (Chart 2). Right here and now, no such potential squeeze fuel is present – at least not until the end of January.
That said, the Nasdaq is a different story altogether. At the end of January, short interest there rose 5.2 percent to a fresh high (chart here). This is a massive squeeze opportunity should the bulls manage to regroup. But the tech-heavy index also acts weaker than the S&P 500. The Nasdaq remains under both the 50- and 200-day and corrected 19.2 percent over a couple of months though the January 24 hammer low. Plus, unlike the S&P 500, the Nasdaq has retraced just short of 50 percent of its decline, let alone 61.8 percent.
Without tech beginning to get its act together, it will be tough for the S&P 500 take out the Fibonacci resistance it faces.
Thanks for reading!
