
Bulls and bears continue to show up at 2600 and 2800 respectively. The S&P 500 just tested support – successfully. Odds favor a rally here. There is dry powder in money-market funds, even as fear reflected in the options market has room to unwind.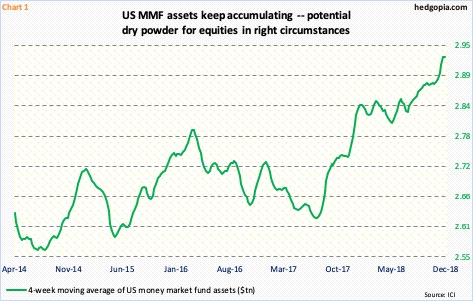
US money-market-fund assets keep building. This is potential dry powder for stocks in the right circumstances.
On an absolute basis, the $2.94-trillion total late November was the highest since April 2010. Just since the week ended October 3, when the S&P 500 began its waterfall dive, they have gone up by $73 billion.
Chart 1 uses a four-week moving average. The green line has been trending up since July last year. Since July this year, it has gone straight up, particularly since October. That is when US stocks began to meaningfully drop.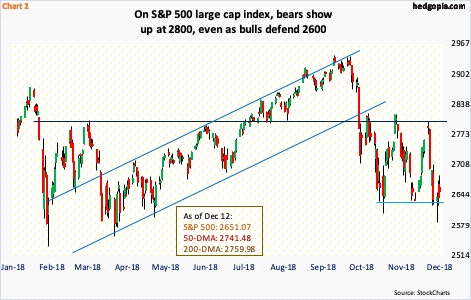
The S&P 500 large cap index peaked at 2939.86, merely 1.06 points short of surpassing the all-time high reached on September 21, just before a painful rout. By this Monday, it was down to 2583.23, which undercut the lows of October and November intraday but not on a closing basis.
The selloff in October stopped later that month when bulls showed up just north of 2600. The subsequent rally stopped at 2800, which since February this year has proven to be an important level. Bulls again showed up just north of 2600 in November, and once again the subsequent rally was met with selling at 2800 (Chart 2).
Should the pattern of back-and-forth between 2800 and 2600 not break, odds favor stocks rally here. Both daily and weekly momentum indicators are in oversold territory.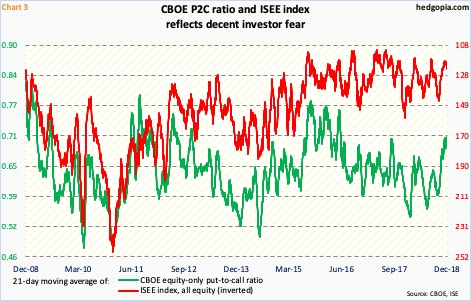
Should things evolve this way, Chart 1 can help. So does Chart 3. The latter plots the 21-day moving average of the CBOE equity-only put-to-call ratio and the ISEE index, all equity. The latter is a call-to-put ratio, hence inverted.
The ISEE index has risen since bottoming at 119.2 last Thursday, with Wednesday this week at 124. Last week’s low was not that far away from all-time lows from April last year. The CBOE put-to-call ratio does not reflect this level of panic, but is elevated enough. Wednesday read 0.702, with Tuesday’s reading of 0.710 the highest since June 2016. There is a lot of unwinding left in this metric.
Here is the rub. If the S&P 500 meaningfully breaks 2600, the green line in Chart 3 could very well proceed toward the mid-0.70s, which is where the ratio was in February 2016, when stocks reached a major bottom. Barring that, unwinding can begin. Support at 2600 on the S&P 500 goes back to February this year, when there was a similar swift and sharp drop.
Thanks for reading!
