
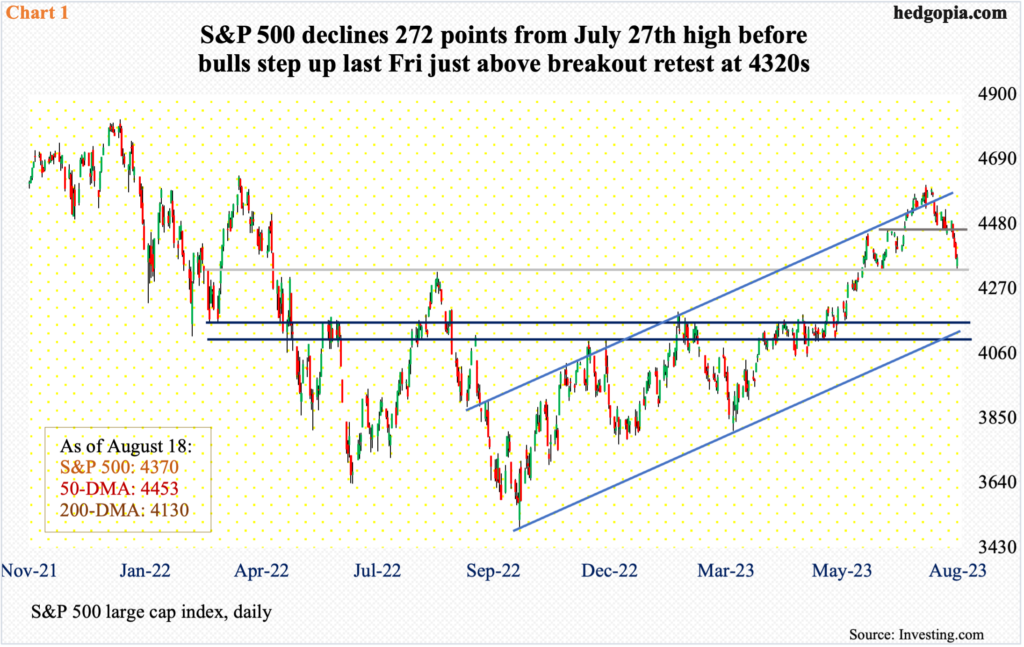
From its July 27 high through last Friday’s low, the S&P 500 quickly shed 5.9 percent. A relief rally looks imminent as equity bulls are not in a mood to let go breakout retest at 4320s. Not now anyway. Mid-to long-term, they are fighting several headwinds – shrinking bearish bets, reduced willingness to take on debt and a lack of inflows.
The S&P 500 has dropped to a level that is likely to induce a cutthroat bull-bear duel, with odds favoring the former prevails for now.
Last Friday, the large cap index tagged 4335 intraday, and that was used as an opportunity to buy weakness; the session closed at 4370. From the July 27 high of 4607, the S&P 500 was down 5.9 percent through that low.
Earlier, between last year’s low (3492) and the July high, the index shot up 31.9 percent. As the S&P 500 rallied relentlessly, several potential friction points gave way, including last August’s high of 4325, which was eclipsed on June 12. Friday’s low just about tested that breakout – successfully (Chart 1).
Mid- to long-term, the S&P 500 has plenty of room to go lower. The 200-day lies at 4130, and at least a test of the average is the path of least resistance. Immediately ahead, there is horizontal resistance at 4450s, which coincide with the 50-day, and the bulls are probably eyeing this.
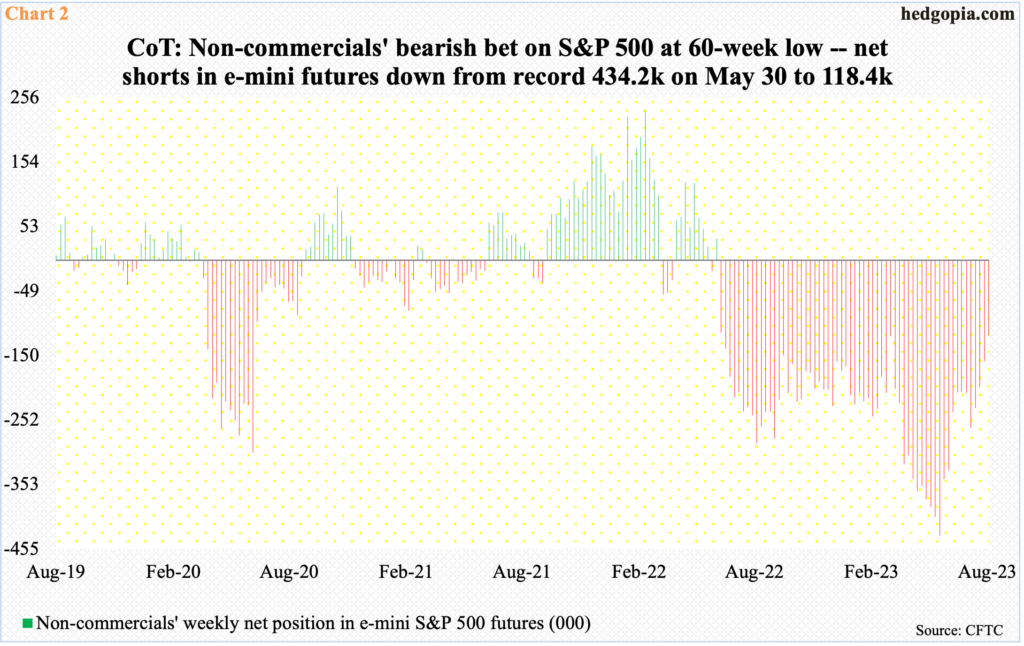
Equity bulls face the disadvantage of shrinking bearish bets.
The S&P 500 bottomed on October 13 last year. During that week, as of the 18th, non-commercials were net short 223,198 contracts in e-mini S&P 500 futures. By the week to March 14, they had cut down their holdings to 119,819. On March 13, the S&P 500 printed 3809, having retreated from 4195 posted on February 2. These traders were obviously not convinced a durable trough was at hand, so continued to press. By the week to May 30, they had built up a record 434,170 net shorts; the cash finished that session at 4206, before proceeding to rally another 400 points through July 27 – aided by non-commercials’ short covering. As of last Tuesday, net shorts are down 72.7 percent from May’s record high to 118,408 (Chart 2).
The potential fuel for short squeeze is no more – or essentially nominal.
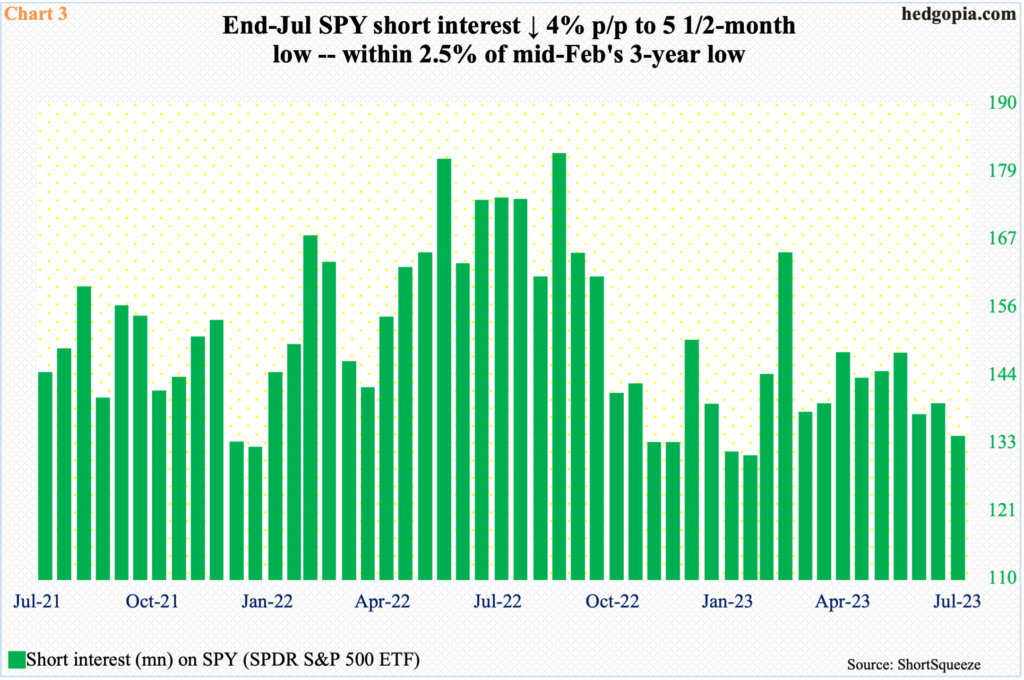
In the short interest arena, it is the same situation.
Mid-September last year, short interest on SPY (SPDR S&P 500 ETF) stood at 180.5 million, which was the highest since end-February 2021. As the S&P 500 rallied, shorts began to turn tail, cutting their exposure to 129.7 million mid-February, which was a three-year low. At the end of July – the latest period for which data is available – short interest was 132.9 million, which was only 2.5 percent from the mid-February low (Chart 3).
In other words, what once acted as a tailwind to the S&P 500 is now acting as a headwind.
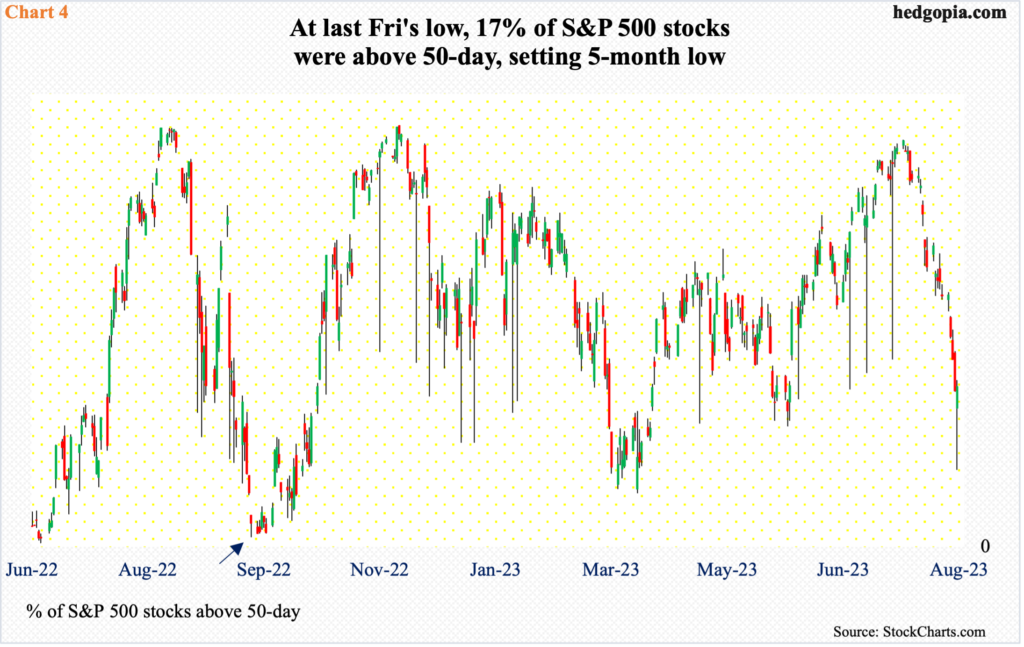
Hence the downward pressure from July 27. In that session, 87.4 percent of S&P 500 stocks were above their 50-day intraday; three sessions before that, 89.8 percent were.
Historically, this metric tends to peak at low-90s. The drop since the late-July highs has been relentless. At the lows last Friday, 17 percent of these stocks were above the average, although by the time the session ended, 35.4 percent were.
The intraday reversal raises the odds the oversold condition the daily is in gets unwound in the sessions ahead. This, however, is not happening from washout territory. For reference, on September 23 last year, only 2.2 percent of S&P 500 stocks were above the 50-day (arrow in Chart 4). Or, in March 2020, there were several sessions of low-single-digit readings, with a low of one percent occurring on the 12th.
Friday’s 17 percent obviously does not qualify for a washout, but low enough to induce upward pressure in the near term.
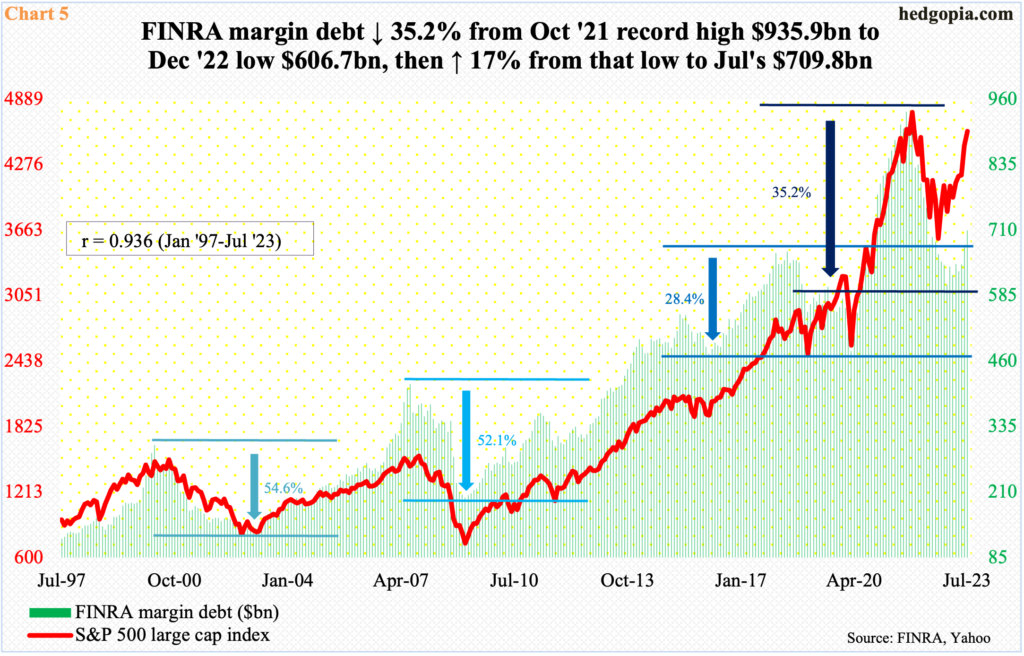
Mid- to long-term, margin debt is not in cooperation with equity bulls.
FINRA margin debt was up 4.2 percent month-over-month in July to $709.8 billion – a 14-month high and up $103.2 billion from last December’s 30-month low of $606.7 billion. Through that low, margin debt tumbled 35.2 percent from the all-time high of $935.9 billion posted in October 2021 (Chart 5). Back then, both the Nasdaq 100 and the Russell 2000 small cap index peaked in November that year, even as the S&P 500 did so in the following January. All these three indices – and others – bottomed last October, with margin debt troughing in December.
Margin debt and stocks maintain a tight correlation, with the S&P 500 maintaining an ‘r’ of 0.936 going back to January 1997.
At July’s high, the S&P 500 was 4.6 percent from its all-time high, while the Nasdaq 100 was 5.2 percent from its. July’s margin debt, in contrast, was still 31.8 percent from its record high. Bulls obviously are not as enthusiastic to take on leverage this time around as they were in 2021.
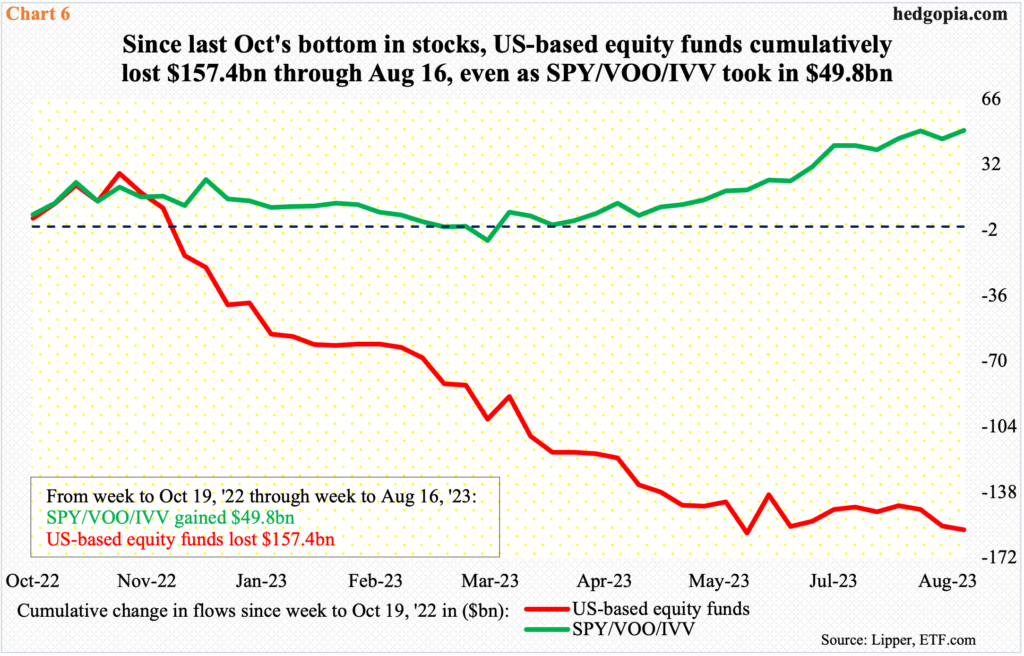
Flows paint the same picture.
Chart 6 tallies flows into US-based equity funds and three S&P 500-based ETFs – SPY, VOO (Vanguard S&P 500 ETF) and IVV (iShares Core S&P 500 ETF) – beginning the week to October 19 last year; once again, the S&P 500 bottomed on the 13th that month.
Through last Wednesday, US-based equity funds have bled $157.4 billion. The relentless rally in stocks since last October has not mattered to these funds, as they are deep in the red. The saving grace is the three ETFs, which have collectively pulled in $49.8 billion, but even here one would think inflows would be healthier. But they are not. Bulls are treading it cautiously, as is also evident in margin debt.
These are the headwinds bulls will face in the weeks and months ahead. Near term, odds are in their favor – if nothing else just to unwind the pessimism that has built up over the past couple of weeks.
In the options market, the CBOE equity-only put-to-call ratio produced readings in the 0.70s in all of the last seven sessions, with last Wednesday coming in at 1.03, followed by Thursday’s 0.97. The last one-plus reading was on March 10, and the S&P 500 put in a low on the 13th.
Thanks for reading!
