
Up 3.3 percent at one time, the S&P 500 ended January down 0.2 percent. ‘As January goes, so goes the year’ adage is not fail-safe but worth paying attention to. Not the least because the index rallied nearly 29 percent last year, pushing several metrics into extremely overbought territory.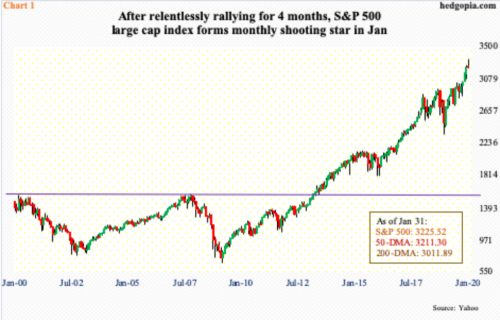
With January just over, the year is shaping up to be a volatile one. The so-called January barometer posits that how January fares sets the tone for the year. The S&P 500 Large Cap Index lost 0.16 percent in the first month. But the verdict could have been cleaner.
At one time, bulls were firmly in control last month. Through the all-time high of 3337.77 on January 22, the index (3225.52) was up 3.3 percent, before gradually losing all of it, and then some.
Plus, major indices were not all down in January. The Dow Industrials lost one percent, the Russell 2000 Small Cap Index declined 3.3 percent, even as the Nasdaq Composite gained two percent.
Besides this mixed performance, the fact remains that all these indices put in a very weak performance in the last few sessions. Technically, the S&P 500 ended up with a monthly shooting star (Chart 1). It is a bearish pattern, showing up after four positive months. From the lows of early October, the index rallied just under 17 percent before reversing. Going back even further, the S&P 500 jumped just north of 42 percent from the lows of late December 2018. Needless to say, things are crazy overbought. In the right circumstances for bears, unwinding could take a while.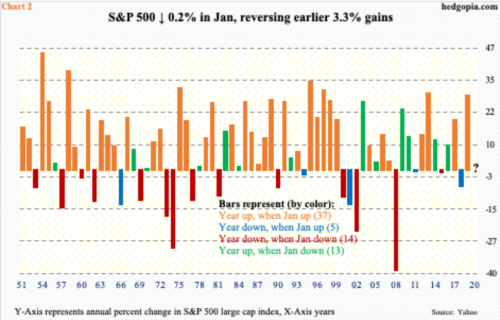
If this is what the January barometer is signaling, then we could be in for a volatile year. Here is the thing, though. The barometer’s track record is best when January is up. Last year, the S&P 500 rallied 28.9 percent, with the opening month exploding 7.9 percent. There are exceptions of course, with the index down 6.2 percent in 2018, even though January was up 5.6 percent.
Chart 2 looks at the S&P 500 annual returns going all the way back to 1951, with an obvious question mark for 2020. The data is divided into four buckets: (1) years that were up when January was up, (2) years that were down when January was up, (3) years that were down when January was down, (4) years that were up when January was down. In parenthesis is the number of years for each bucket.
The data set covers 69 years. The January barometer came true in 51 of them, which is pretty good. Orange bars clearly stand out in the chart. Since January was a down month, the red and green bars are relevant this year. If past is prelude, it could go either way. Since 1951, there have been 13 years in which the year ended up with a down January. Fourteen other times, both the year and January went down.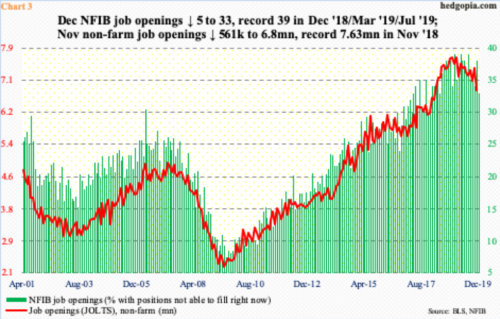
Obviously, bears are hoping for a red bar this year, and bulls for a green one.
It is an election year in the US. Going back to 1928 covering 23 election years, the S&P 500 was negative in only four. So, bulls have that going for them. But stocks are also coming off a very good year. A giveback is always possible.
Plus, several issues that could negatively impact investor psyche lurk globally. Brexit has happened. The UK has left the EU, but a bulk of the work remains. The two sides have agreed on a transition period that keeps current rules and regulations in effect until the end of this year. Negotiations are likely to be rocky. Then, there is the US-China trade dispute. Phase one trade deal is definitely not the end of it.
Depending on how these issues – and others – shake out, the risk to the global economy is to the downside. Already in the US, after nearly 11 years of post-Great Recession recovery/expansion, jobs – one of the strongest pillars – are showing some cracks. Job openings, in particular.
In December, NFIB job openings dropped five points month-over-month to 33. In the 12 months before that, record 39 was hit three times. It increasingly feels like it hit the wall at that high. Similarly, non-farm job openings in November collapsed 561,000 m/m to 6.8 million, with the record high 7.63 million in November 2018.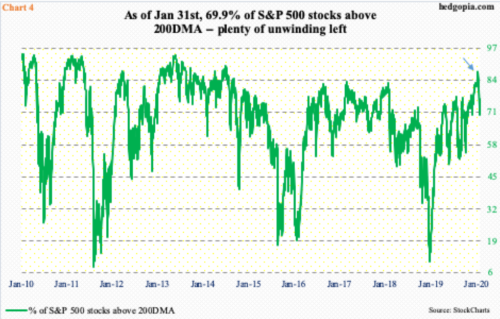
If the weakness in openings is not a one-off rather the beginning of a trend, then equity bulls have their work cut out this year. The January barometer could very well be trying to forewarn of this possibility. Particularly so considering how extended things are. Chart 4 is one example.
Last Friday, the percent of S&P 500 stocks above their 200-day moving average fell 5.01 to 69.94. It has been retreating since reaching a five-and-a-half-year high 87.17 on January 17 (arrow). Historically, a genuine bottom cannot be had until the metric drops to the teens, or low-20s. There is a long way to go between then and now. Should things evolve this way, this would have raised the odds of a red bar in Chart 2.
Thanks for reading!
