
The energizer bunny marches on. The S&P 500 rallied to a fresh high last week. This time around, the otherwise-laggard Nasdaq 100 joined in, meekly breaking out to a new high. Next week, the top six tech outfits are set to report their March quarter. Post-earnings reaction will be telling.
Major US banks and brokers reported their March quarter last week. If the rest of the earnings season follows on their footsteps, then equity bulls are not likely to get much of an earnings tailwind.
XLF (SPDR Financial Sector ETF) did rise 0.7 percent last week, even as the S&P 500 large cap index rallied 1.4 percent, but of the top six financials reporting, two (Wells Fargo [WFC] and Goldman Sachs [GS]) were up, one (Citigroup [C]) was flat and three (JP Morgan [JPM], Bank of America [BAC] and Morgan Stanley [MS]) were down for the week.
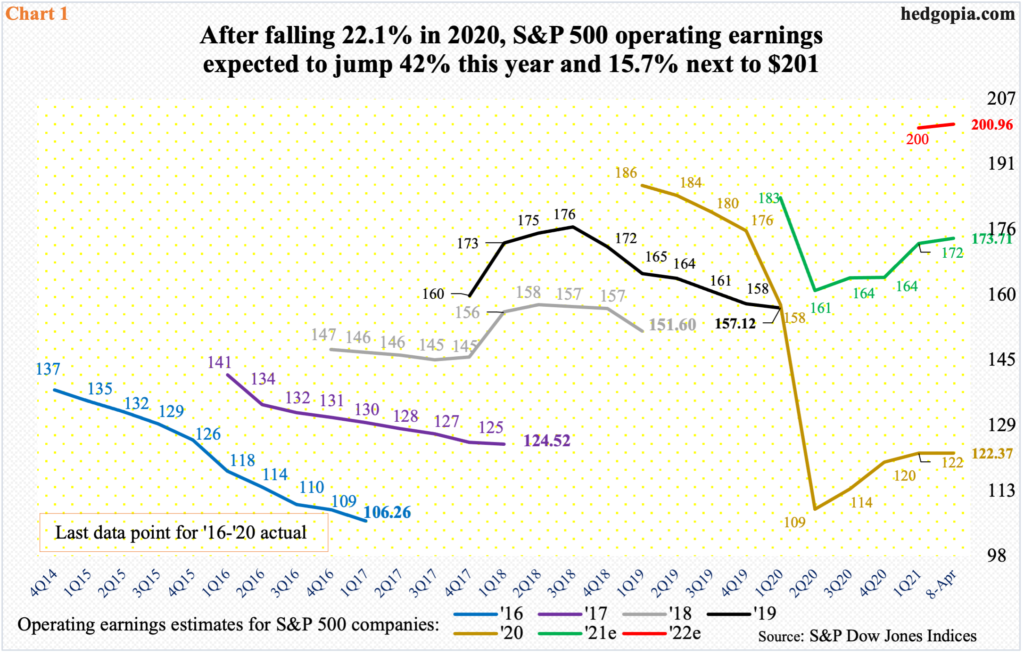
Stocks had rallied strongly into earnings. The revision trend of earnings was on the upswing as well; 1Q21 operating earnings estimates for S&P 500 companies bottomed at $37.04 last December and ended April 8 at $39.31. So, it is possible longs used this as an opportunity to lock in their gains.
Earnings optimism remains high. Overall, 2021 is expected to bring in $173.71, up from 2020’s $122.37. Momentum is expected to continue next year, with the sell-side penciling in $200.96 (Chart 1).
After last week’s rather tentative post-earnings reaction to financials, another test awaits next week when the bigwigs report. Apple (AAPL), Microsoft (MSFT), Amazon (AMZN), Google owner Alphabet (GOOG/L), Tesla (TSLA) and Facebook (FB) all report next week.
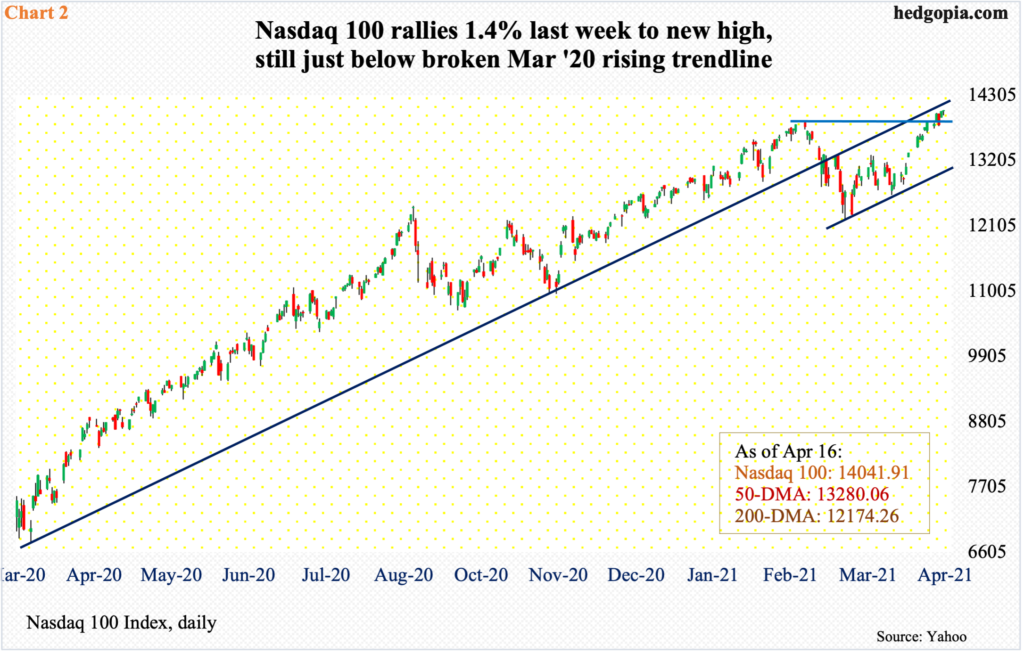
Leading up to this, the Nasdaq 100 (14041.91) broke out to a new high last week. That said, tech bulls do not have much leeway here. There is short-term support at 13840s, and they need to be able to defend this before the tech heavyweights report.
The index already sits underneath the broken rising trend line from March last year. From bulls’ perspective, the good thing is that after dropping 12 percent the Nasdaq 100 bottomed on March 5; this was followed by a higher low on the 25th. If bulls fail to save 13840s, this trend line will be tested around 13000 (Chart 2).
Tech otherwise has been a laggard this year. Both the Nasdaq 100 and the S&P 500 peaked on February 16 before retreating. The latter went on to surpass that high in March, while the former traded under its 50-day in essentially all of March before reclaiming the average at the start of April.
For the Nasdaq 100, the six mentioned above wield too much of an influence, accounting for over 44 percent share. In fact, the problem of concentration is not just limited to the Nasdaq 100.
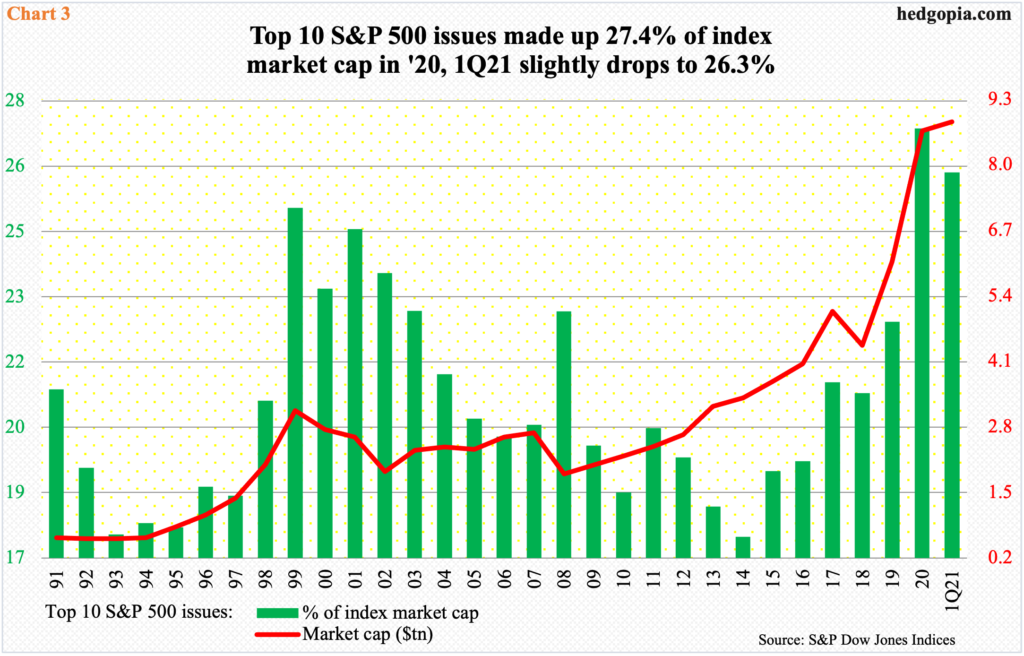
In the S&P 500, the top 10 in January made up 28.1 percent of the index value, ending 1Q at 26.3 percent (Chart 3). At the end of 1Q, AAPL, MSFT, AMZN, FB, GOOGL, GOOG, TSLA, Berkshire Hathaway B (BRK.B), JPM and Johnson & Johnson (JNJ) accounted for $8.9 trillion of the $33.6 trillion of S&P 500 market cap, up from $5.4 trillion in March last year. (In the top 10, Alphabet A & C are treated as separate entities).
In essence, as the top six go so goes the Nasdaq 100. Last week, only two of the six – MSFT and GOOG – rallied to new highs. In this regard, next week’s earnings could not be more timely.
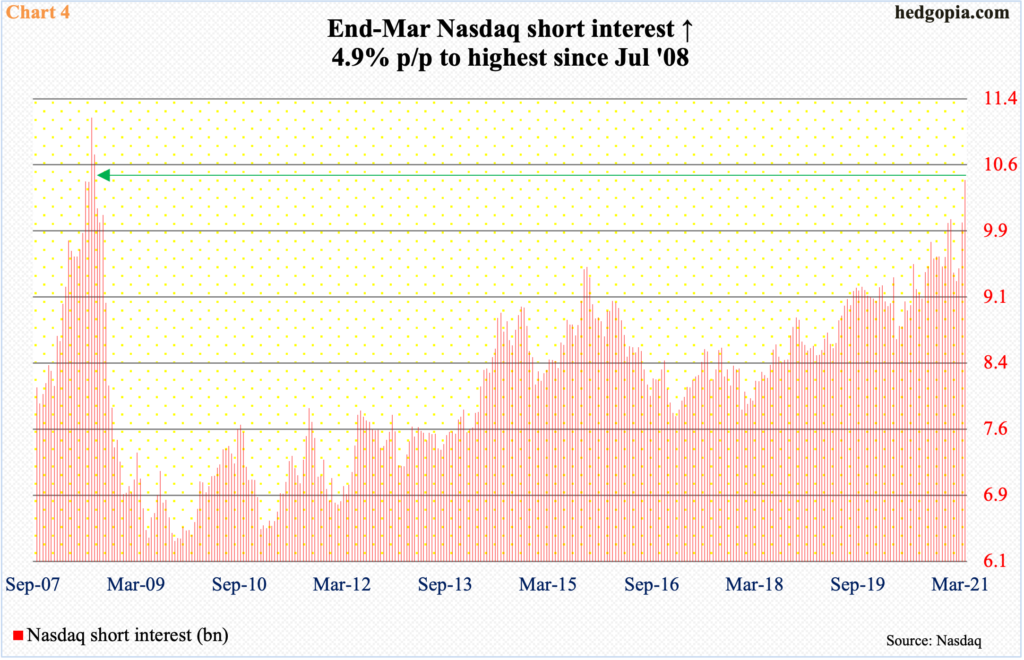
Shorts remain emboldened. At the end of March, Nasdaq short interest rose 4.9 percent period-over-period to 10.5 billion. This is the highest since July 2008; the all-time high of 11.2 billion was recorded in that month (Chart 4).
Next week’s earnings can act as a catalyst for short squeeze – or not. Back in 2008, shortly after short interest reached that record, the Nasdaq 100 came undone beginning September of that year.
Of late, flows have been in cooperation. Flows into US-based equity funds decelerated to $760 million in the week to last Wednesday, although the streak of inflows got extended to 10 weeks, during which $106 billion came in (courtesy of Lipper).
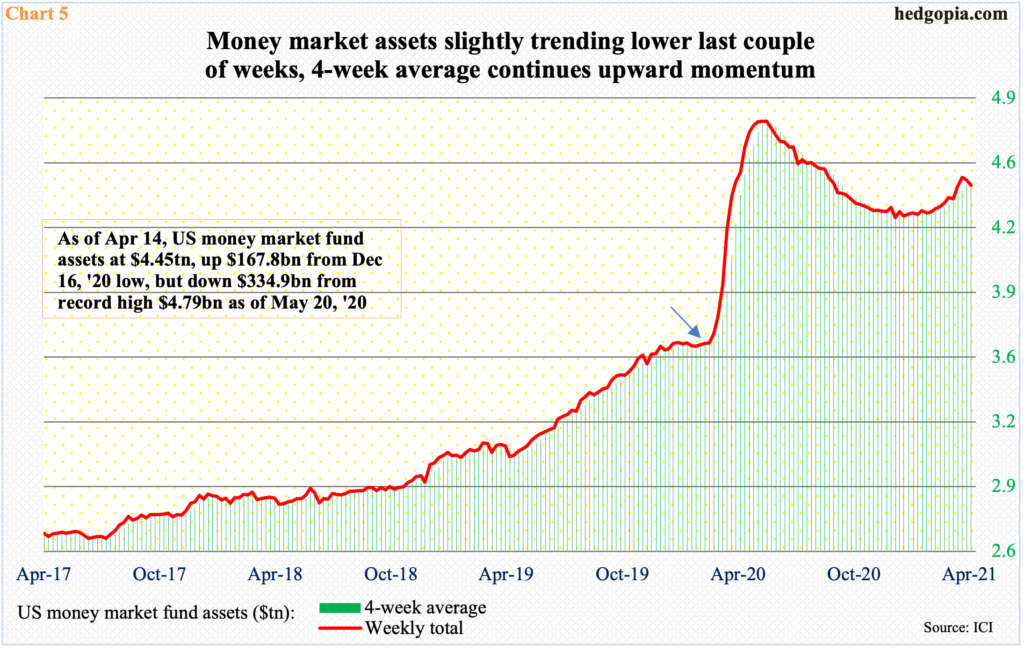
This can continue – at least equity bulls hope so – should the so-called cash-on-the-sidelines begins to cooperate. As of last Wednesday, money market funds held $4.5 trillion in assets. This is $335 billion less than the record high $4.8 trillion set in last May, but $519 billion more than just before stocks reached a major low in March last year (arrow in Chart 5), with the S&P 500 surging 91 percent since. In other words, the massive rally in stocks has been unable to suck in all the cash.
This can act as dry powder, but a lot of things have to go right, not the least of which is how earnings from the top six get treated next week.
Ahead of this, money market assets decreased the last two weeks, although the four-week average continues to trend higher.
From bulls’ perspective, both short interest and money market funds are potential tailwinds. They otherwise have had tremendous cooperation from foreigners and leverage.
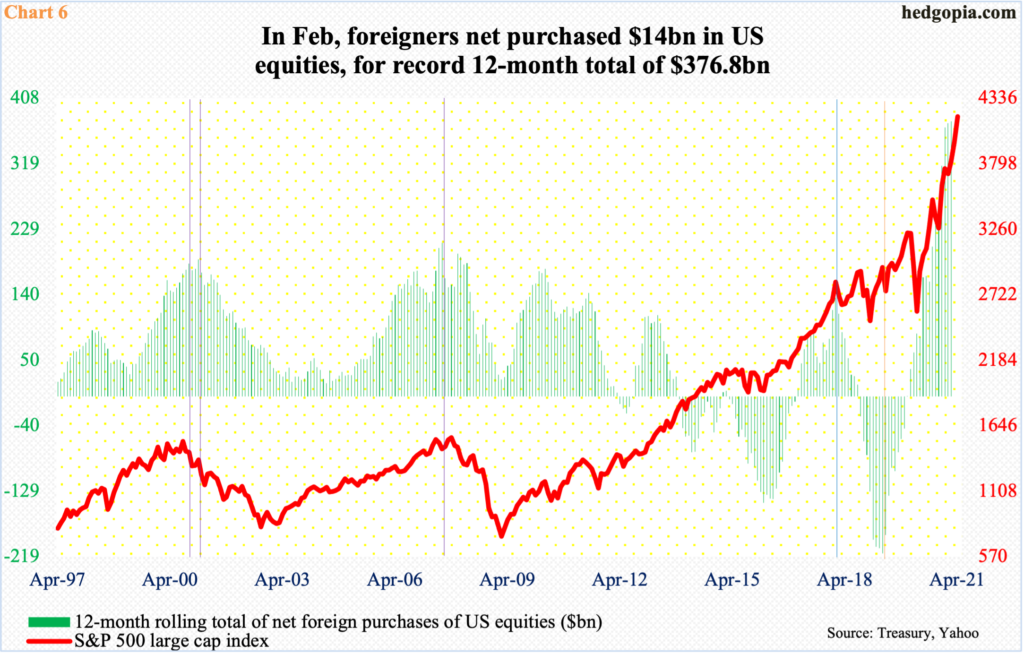
In February, foreigners added $14 billion in US stocks, for a 12-month total of $376.8 billion – a record. This is quite a sentiment reversal on their part as in April 2019 they were selling $214.6 billion worth – also a record.
Perhaps revealingly, in February and March last year when stocks were getting sold off hard, foreigners had been actively raising exposure. This has paid off very well.
Their action is worth a close watch, as the green bars and the red line in Chart 6 tend to move hand in hand.
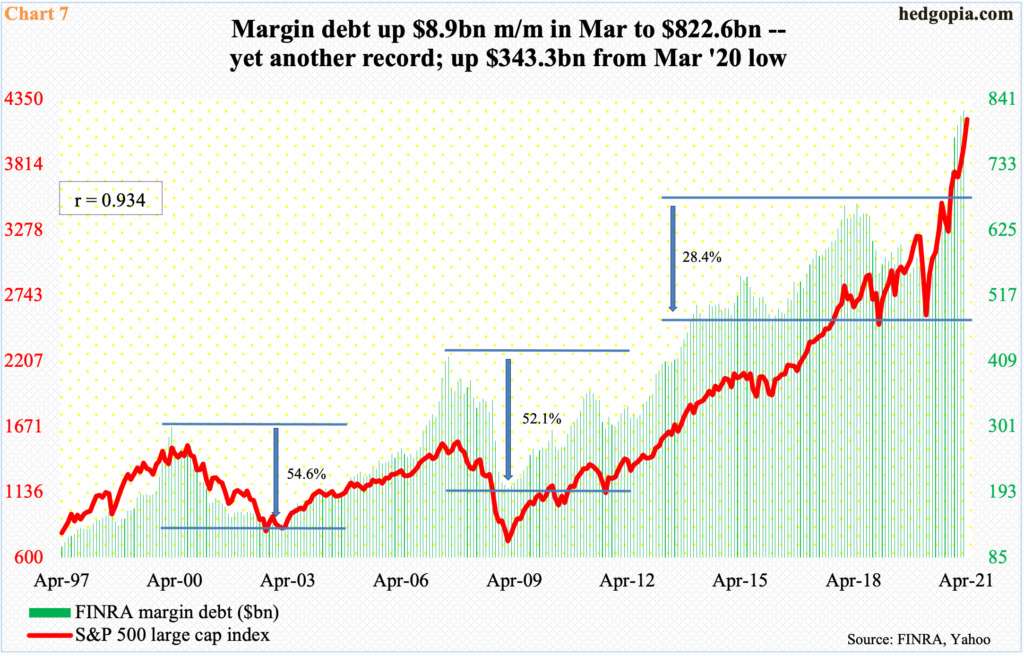
This is also true in Chart 7, which plots the S&P 500 against FINRA margin debt.
In March last year, when the S&P 500 bottomed, margin debt troughed at $479.3 billion, down 28.4 percent from the May 2018 high of $668.9 billion. The prior two bear-market drawdowns were in excess of 50 percent. The rise from that low is no less impressive.
In March (this year), margin debt grew $8.9 billion month-over-month to $822.6 billion – a fresh record and up 71.6 percent from March last year. There has been a distinct rise in the willingness to lever up, which has provided a massive tailwind to the ongoing momentum. That said, the parabolic look to both margin debt and the S&P 500 from March last year is setting up for painful unwinding – the question is of timing.
There has been a perception of late that tech got hurt because of rising rates. There is not a whole lot of historical inverse relationship between the two. Even in March last year, when the Nasdaq 100 bottomed, the 10-year treasury yield bottomed as well at 0.4 percent.
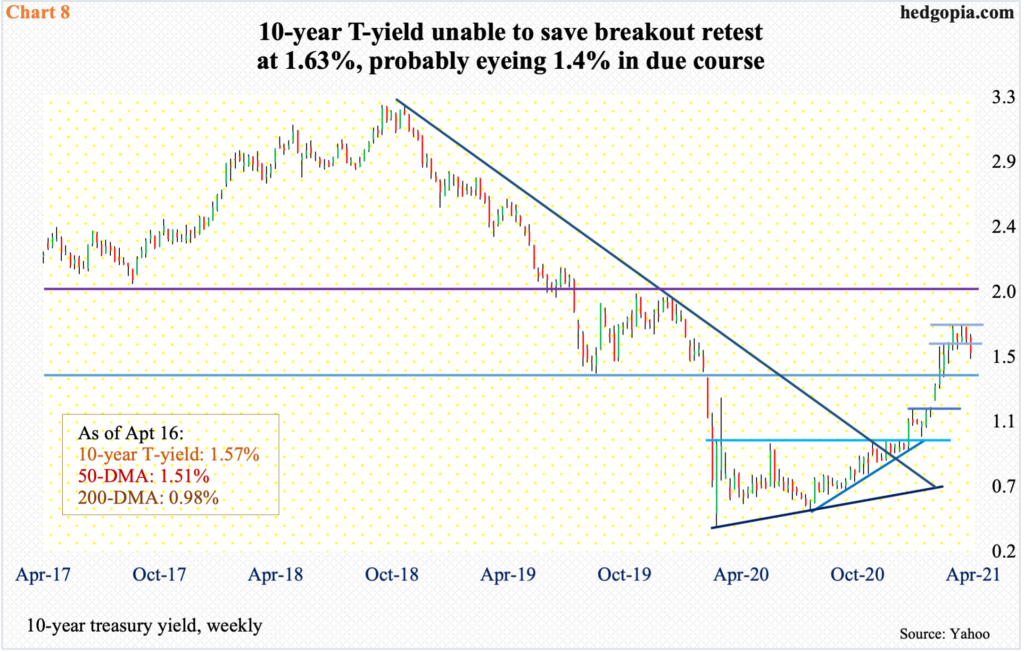
Rates broke out of one percent in early January, followed by 1.2 percent mid-February and 1.4 percent toward the end of that month. The Nasdaq 100 peaked on February 16. Mid-March, the index was still having trouble at its 50-day, even as the 10-year yield broke out of 1.63 percent, ultimately peaking at 1.77 percent on March 30.
Since that high, yields have come under pressure, and are giving out signs they are getting ready to roll over. Nearest support lies at 1.4 percent, with the 50-day at 1.51 percent. Tech should do well, if the prevailing investor perception holds water. Inability to do so will be telling. The other thing is, the 10-year on the daily is oversold and can rally toward the broken 1.63 percent.
Either way, tech needs to prove itself. Post-earnings reaction to the six companies above will give us more clues.
Thanks for reading!
