
The S&P 500 is up nearly 21 percent from last October’s low. Yet, US-based equity funds continue to bleed, and margin debt is lower from October through April. If equity bulls cannot mend the situation soon, non-commercials, with most net shorts in e-mini S&P 500 futures since September 2007, are positioned very well.
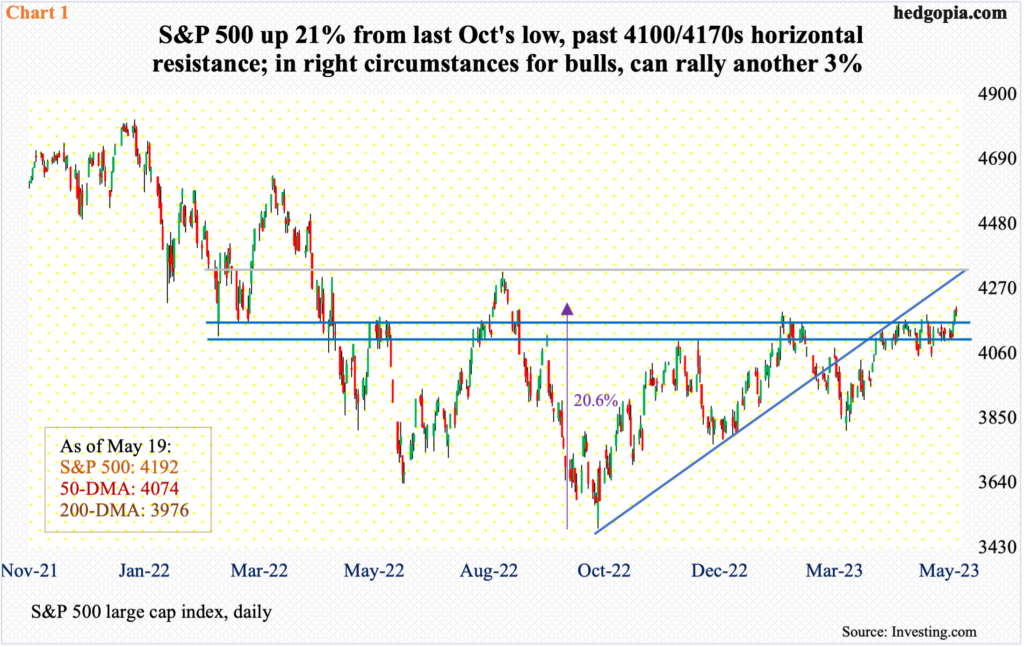
Since the October 13, 2022 low of 3492 through last Friday’s high of 4213, the S&P 500 is up 20.6 percent on an intraday basis. It has been seven months since that low. If equity bulls had their way, they would love to test another level of resistance, which is three-plus percent away.
Last August, the large cap index retreated after tagging 4325 on the 16th and kept dropping until the October bottom. A rising trendline from that trough was breached in February and the index has struggled at that resistance since. The underside of that trendline currently approximates the August high (Chart 1).
Last week, bulls succeeded in taking out horizontal resistance at 4170s-4180s. This preceded a 4100 breakout in late March-early April. They deserve the benefit of the doubt as long as the index remains above this level.
Near-term, however, the daily is beginning to get extended.

The S&P 500’s seven-month, 21-percent rally has come at a time when flows are hardly cooperating. Depending on one’s bias, this can be viewed both negatively and positively. From bulls’ perspective, this creates room for more upside as the fence-sitters get dragged into the bullish bandwagon. Bears, however, would like to question the sustainability of the rally, which indeed has failed to open a floodgate of inflows.
Chart 2 highlights inflows – or a lack thereof – since last October’s low. From the week to October 19 (last year) through last Wednesday, US-based equity funds experienced withdrawals of a whopping $144.7 billion. The only saving grace has been combined inflows of $11.4 billion into SPY (SPDR S&P 500 ETF), VOO (Vanguard S&P 500 ETF) and IVV (iShares Core S&P 500 ETF).

On the earnings front, seven months after last October’s trough in the S&P 500, 2023 estimates continue lower. Back then, the sell-side had penciled in $235.67 for this year. By then, the revision trend was already down, having peaked at $250.12 as of April 27 (last year). Fast forward to now, and 2023 is now expected to bring home $218.38. With 2022 having bagged $196.95, earnings are expected to grow 10.9 percent this year, which in and of itself raises the odds of more revision surprises to the downside in the months ahead.
For whatever it is worth, earnings are expected to grow another 11.6 percent next year to $243.77 (Chart 3). Increasingly, these look like pie-in-the-sky estimates from a group of analysts which historically do show a tendency of being very optimistic early on and take out the scissors as the year progresses.
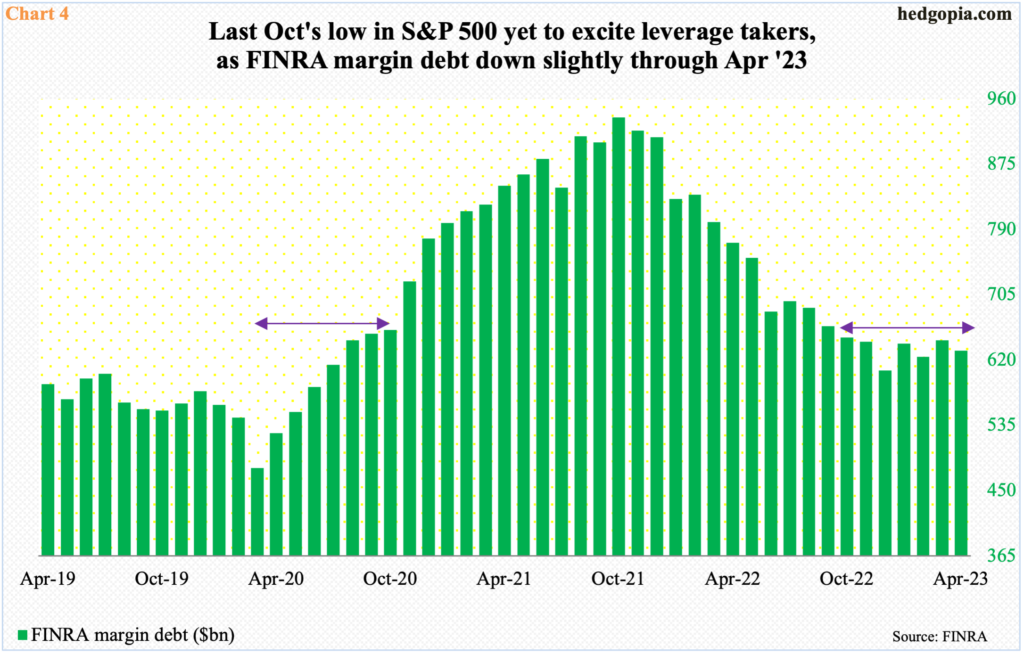
The seven-month rally is also yet to seriously excite leverage.
FINRA margin debt was $649.6 billion last October, having peaked a year earlier at $935.9 billion in October 2021, which by the way was twice what it was in March 2020 when the Covid-caused swoon in stocks bottomed.
Margin debt bottomed at $479.3 billion in March 2020. It then persistently rose, reaching $659.3 billion by October that year, and continuing to push higher until October 2021 when a new record was set.
This time around, last October’s reading is yet to be surpassed, with April at $631.9 billion (Chart 4). The unwillingness to take on leverage even after a 20-percent rally does not speak very highly of the seven-month rise.

A similar message is coming out of the futures pit.
In 2020, the S&P 500 bottomed at 2192 on March 23. In the week to March 24, non-commercials were net long 12,688 contracts in e-mini S&P 500 futures. They obviously were not too sure the cash had just reached a major low, switching to net short. By the week to June 16 that year, they had accumulated 303,305 net shorts. It took these traders a while before getting convinced the index had bottomed, switching to net long by the week to September 8; by October 27 – seven months after the March bottom – they were sitting on 115,439 net longs (Chart 5).
It is the other way round this time. By the week to October 18 last year, non-commercials were already net short 223,198 contracts. From the January 2022 record high of 4819 through the October 13 low of 3492, the S&P 500 tumbled 27.5 percent. They had been net short since June (last year), so nailed it directionally.
But, as stated in previous paragraphs, since the October bottom, the cash is up north of 20 percent. But non-commercials are not buying it. Their holdings were down to 119,819 net shorts by March 14, just before they shifted into higher gear, ending last Tuesday with 388,721 net shorts.
This is the most net short non-commercials have gotten since September 2007. Back then, they accumulated 408,653 net shorts before cutting. It was a very profitable trade for them back then. The S&P 500 peaked at 1576 in October that year and by March 2009 had tumbled to 667.
That said, the aggressive positioning of non-commercials also opens up a squeeze opportunity for the bulls, but they have to deliver. As previously explained, flows data is not cooperating, nor is margin debt, among others. In the event non-commercials get squeezed, the path to last August’s high becomes easy; even in this scenario, the bulls will then have run out of options. If a squeeze does not materialize, non-commercials have decent odds of making another killing in the months ahead.
Thanks for reading!
