
In the latest week, non-commercials cut net longs in gold futures by three percent period-over-period to 169,512 contracts. This was the first weekly reduction in eight weeks (Chart 1). The prior week’s holdings were the highest since February 3rd last year.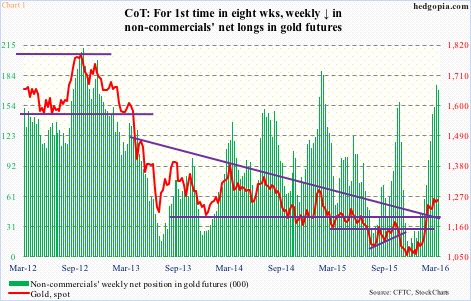
Sixteen weeks ago (as of December 1st last year), these traders cut back net longs to 9,750 contracts – the lowest since October 2002 – before adding. Spot gold bottomed two sessions later. Hard to tell if gold followed non-commercials higher, or it was the other way around.
Either way, this is a group worth paying attention to. The red line and the green bars in Chart 1 move eerily together.
The drop in non-commercials’ holdings last week has come amidst a sideways action in spot gold for the past five weeks.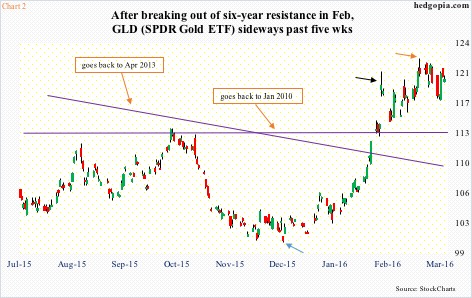
Since gold spiked on February 11th, it has essentially marked time. Chart 2 portrays GLD, the SPDR Gold ETF. In it, the February 11th spike is denoted by the black arrow. That was five weeks ago. Non-commercials’ net longs went from 98,428 contracts on February 9th to 174,810 on March 8th, before dropping three percent last week. Throughout this, the metal has not moved much, raising the risk that these traders may run out of patience.
There are similar dynamics in play elsewhere.
On December 17th, gold successfully tested the low on December 2nd, and began to move higher (blue arrow in Chart 2). Incidentally, the metal began to move up well before U.S. stocks peaked on December 29th. Since that December 17th low, GLD has attracted tons of money.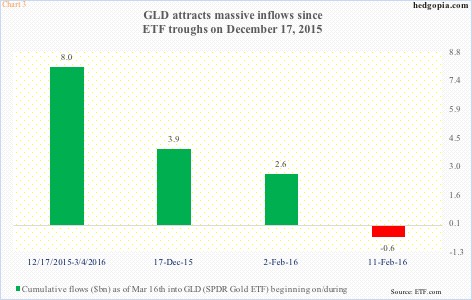
Chart 3 looks at four relevant dates with respect to flows into GLD through March 16th.
February 2, 2016: The day before the ETF broke out of its 200-day moving average. This was the first close above the average since October 15th last year. Just under $2.6 billion moved into the ETF since February 2nd.
February 11, 2016: GLD rallies 5.6 percent intra-day but closes up only four percent. Since then, the ETF essentially has gone sideways, give and take. A little north of $564 million has been withdrawn since February 11th. However, on March 15th, $4.2 billion was withdrawn, so that has hugely skewed the data.
December 17, 2016: GLD successfully retests the December 2nd low before rallying sharply (blue arrow in Chart 1). Nearly $3.9 billion has moved into the ETF since.
December 17, 2015-Mar 4, 2016: December 17th, of course, was that successful test of the December 2nd low. March 4th was the session in which the ETF spiked 1.4 percent intra-day to $122.37, but closed the session slightly down – producing a shooting star (orange arrow in Chart 2).
For technically oriented GLD longs, that candle was a warning shot that the ETF was getting tired. Spot gold’s intra-day high in that session (March 4th) was $1,280.7. The metal went on to make another high on March 11th at $1,287.8, before reversing hard. The reversal is taking place at an interesting spot.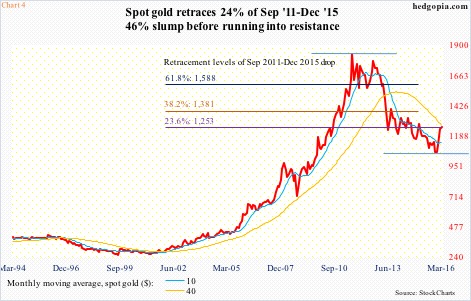
Between the September 2011 all-time high and the December 2015 low, gold slumped 46 percent. A 23.6-percent retracement of that decline lies at $1,253 (Chart 4). Spot gold closed last Friday at $1,256.
Combine this with current grossly overbought conditions – daily in particular, but also weekly – and recent signs of fatigue, the metal seems ready for a breather at best and a reversal at worst.
This can have implications for GLD flows. As stated earlier, since February 11th, $564 million has been withdrawn. But that is after accounting for $4.2 billion withdrawn on March 15th. Even after these outflows, since December 17th, inflows are a positive $3.9 billion.
After a five-week-long sideways action, should the yellow metal begin to unwind its overbought conditions, risks of outflows rise.
Further, the metal has already had time to react to three major central bank decisions – all of them dovish and gold-friendly.
On January 29th, the BoJ adopted negative interest rate policy for the first time. On March 10th, the ECB massively expanded its stimulus program. And on March 16th, the Fed switched from hawkish to dovish stance. All three surprised the market.
Gold reacted positively to the BoJ decision as this took place right before the February 3rd 200-DMA breakout, but was unable to use the ECB and FED decisions to break out of the five-week sideways action.
That said, it is not all over for gold. The real test occurs at potential breakout retest at $1,180. The corresponding support on GLD ($119.80) lies at $113 and change (Chart 2). Both these price points approximate their respective rising 50-day moving averages.
Hence, it is probably early to aggressively go short the metal.
That said, gold does seem to want to go lower – probably a lot lower if the afore-mentioned support – followed by $1,040 – does not hold. If that support holds, it will just end up being a plain-vanilla drop.
This probably opens the door for a tactical trade – hypothetically selling slightly out-of-the-money weekly calls. The idea is to collect premium at best and go short near recent spikes at worst.
March 24th GLD 120 calls bring $0.90. If assigned, it is a short at $120.90.
Thanks for reading!
