
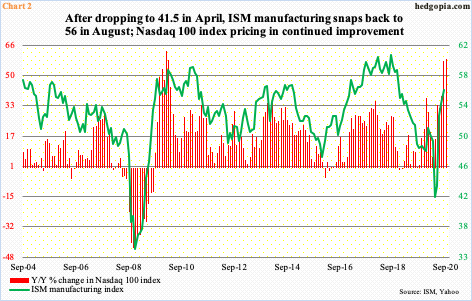
US manufacturing is coming back with a vengeance. Orders are soaring and inventories remain low, raising the odds that the recovery in manufacturing has life left in it. That said, August’s 56 is up substantially from April’s 41.5. Historically, the ISM index has found it hard to sustain above high 50s. If past is prelude, in general, as goes manufacturing so goes the Nasdaq 100.
US manufacturing is snapping back. In August, the ISM manufacturing index rose 1.8 points month-over-month to a 21-month high 56.
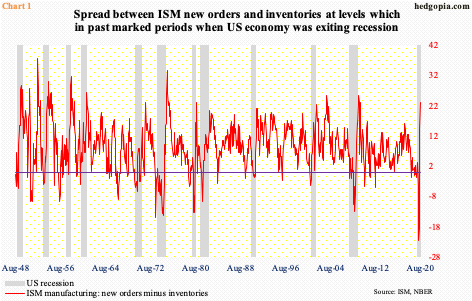
Even impressive is how new orders are coming back, with activity in August up 6.1 points m/m to 67.6 – the highest since January 2004. This is happening at a time when inventories remain subdued. The inventories sub index fell 2.6 points m/m to 44.4, which is the lowest since June 2012.
As a result, the spread between orders and inventories rose to 23.2 in August – quite a reversal from April’s negative 22.6. August’s reading is elevated but for sure is not the highest in this metric’s 72-year history. With that said, it is already at a range that in the past marked periods when the US economy was coming out of recession (Chart 1).
The manufacturing index – the headline number, that is – bottomed in April at 41.5, which was the lowest since April 2009. It has already jumped 14.5 points from that low. In all probability, it is headed higher –if nothing else just to bridge the current gap between orders and inventories.
This is probably what the NASDAQ 100 is aggressively pricing in. Chart 2 uses a year-over-year percent change in the index. In August, it jumped 57.5 percent on that basis. Even better, from March when on the 23rd the index bottomed intraday at 6771.91, it is up 82 percent (no typo). It has rallied for five straight months.
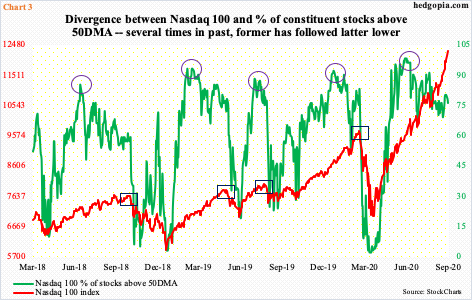
The tech rally is led by the generals – inordinately at that. The soldiers are falling behind. The index (12292.86) is at a new high, but the percent of its stocks above the 50-day is at 76 percent, the latter having peaked on June 2 at 98 percent (Chart 3). Several times in the past, such divergences between the two resolved with the index eventually catching up and heading lower (more on this here).
Time will tell if this is how the current divergence gets resolved as well. Right now, the improvement in the ISM index is providing a tailwind to the bullish sentiment. But at the same time, bulls increasingly are seeking protection in the so-called safe, large names, which in and of itself is a yellow flag, come to think of it. This raises the odds that the generals will begin to fall under their own weight after they would have priced in enough improvement in manufacturing. Historically, the ISM index has struggled to sustain above high 50s.
Thanks for reading!
