
The same way investor fear was pervasive in March, greed is reflected in several metrics currently. Reversal risks are very high medium- to long-term. Near-term, how VIX behaves in the next several sessions will decide if sentiment gets ever frothier. Amidst all the euphoria, the S&P 500 is approaching a crucial juncture.
Last week, the S&P 500 large cap index jumped 3.2 percent and 0.7 percent before that. In both those weeks, VIX managed to edge up. This is not normal volatility behavior. Ordinarily, the S&P 500 and VIX, which represents the market’s expectation of 30-day volatility based on S&P 500 options, go the opposite way.
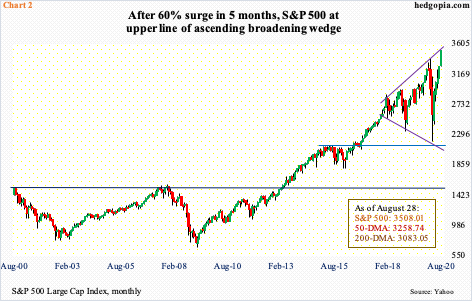
Bulls are enjoying the rally but could also be growing nervous, given the move equities have had the past five months. From the March lows through recent highs, the S&P 500 is up 60 percent, the Nasdaq 100 77 percent and the Russell 2000 66 percent. These are heady gains and have come against the backdrop of lousy fundamentals.
Right before the February-March selloff this year, things were similarly extended, and that did not end well. In merely 24 sessions intraday, the S&P 500 collapsed north of 35 percent. Equities were looking for a pin, and the Covid-19 fulfilled that role. During that selloff, VIX ended up surging to 85.47 on March 18. Fear was pervasive. In the unwinding that followed, volatility has been compressed in quite a fashion.
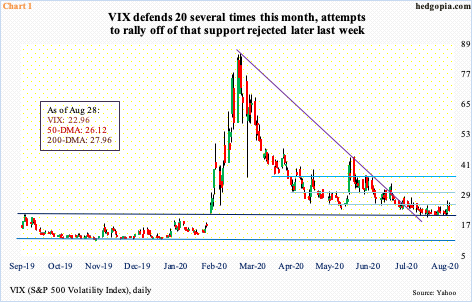
On the 11th this month, VIX dropped to 20.28 intraday. Several times this month, 20 has repeatedly provided support. In each of the last two weeks, VIX formed a weekly long-legged doji, and a spinning top before that. These candles have formed after a persistent decline in volatility. VIX is also no longer bound by a falling trend line from the March peak (Chart 1).
But rallying off of 20 has taken time. Both Thursday and Friday last week, VIX (22.96) rallied strongly intraday but finished poorly, with the 50-day moving average (26.12) in particular coming in the way. The 200-day is at 27.96. Thursday’s high was 27.09. It just feels like VIX is not quite ready to reclaim these averages. The daily RSI is turning back down from just above the median. It is possible 20 gets tested near term.
Should this scenario unfold, bulls will be looking to add more gains. They have had an amazing run. With one session to go, the S&P 500 is up 7.2 percent in August alone – for a back-to-back monthly marubozu. This will be a 5th straight positive month after the index bottomed in March.
Not surprisingly, several metrics are extended. The daily RSI closed last Friday at 79.3. The index (3508.01) continues to pull further and further away from its 200-day; last Friday, the gap was 13.8 percent, which was the widest since late January 2018.
Regardless what happens immediately ahead, longer term the S&P 500 is rapidly approaching the upper line of an ascending broadening wedge. The February-March selloff stopped at the lower line, which also approximated horizontal support (Chart 2). Technicians must be wondering if the same pattern stops the five-month rally.
As this uncertainty surrounds large-caps, as far as small-caps are concerned, bears have put their foot down.
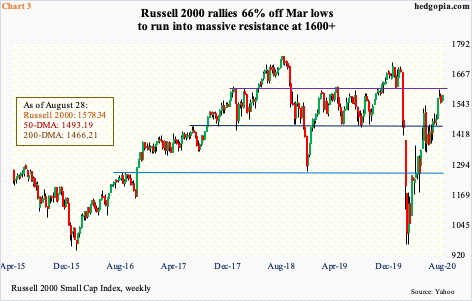
Going back to January 2018, 1600-plus on the Russell 2000 small cap index has proven to be an important price point (Chart 3). Back in February, the level was lost on the 25th as selling intensified. By March 18, the index was down to 966.22. The rally that followed has been no less impressive. Bulls rallied past one after another broken support, including 1450s-60s mid-July.
Three weeks ago, small-cap bulls went after the ultimate resistance. On the 11th this month, 1603.60 was tagged intraday, but only to close poorly at 1575.10; in three other sessions that week, 1590s was hit, but bulls were out of ammo. Last week, sellers repeatedly showed up at 1570s.
At the same time, for several sessions now, bulls defended the 20-day. Near term, it is possible they regroup and charge toward 1600 one more time. Even under this scenario, the Russell 2000 (1578.30) remains substantially below its all-time high of 1742.09 from August 2018.
Contrast this with the likes of the S&P 500 or the Nasdaq 100, which made new highs last week. Even within large-caps, performance is driven by the larger names, such as Apple (AAPL), Microsoft (MSFT) and Amazon (AMZN).
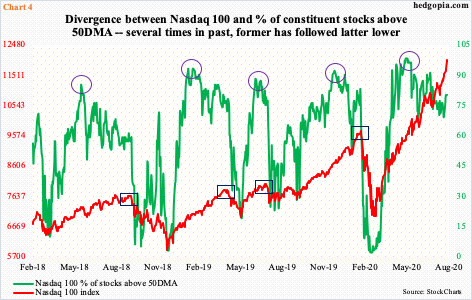
Chart 4 plots the Nasdaq 100 with the percentage share of its stocks above the 50-day. The two have diverged. The index continues higher, but increasingly fewer and fewer stocks are above the average. In other words, the generals are leading but the soldiers are not keeping up.
If past is prelude, over time this resolves with the soldiers dragging the generals lower. In the chart, the circles represent peaks in ‘percent of stocks above the 50-day’. The index continued higher, but only for a while, as shown by the boxes.
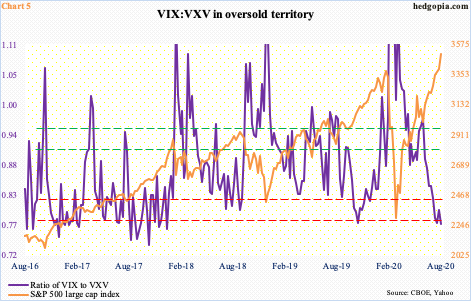
These divergences are appearing amidst excessive optimism evident in several other metrics, such as the ratio of VIX to VXV. As explained earlier, VIX measures the stock market’s expectation of 30-day volatility based on S&P 500 options. VXV achieves the same, but for a longer duration, which is three months.
Typically, at a time of risk-on, demand for nearer-term protection goes down; the opposite occurs when the mood shifts to risk-off. On June 22, the ratio reached 0.97 before retreating; on the 29th that month, the S&P 500 bottomed at 2999.74. Two months and more than 500 points later, the ratio last Friday hit 0.775, which is the lowest since January 2018 (Chart 5). This is extremely oversold territory and points to the prevailing ‘nothing can go wrong’ attitude among investors.
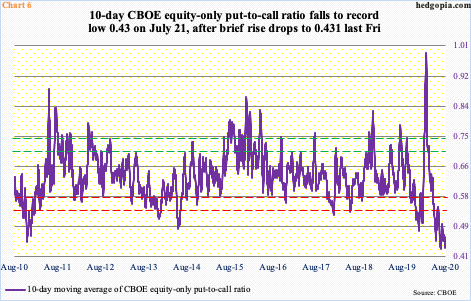
Speaking of which, take a look at the 10-day moving average of the CBOE equity-only put-to-call ratio (Chart 6). On March 19, when the S&P 500, and other major US equity indices, were in the midst of a severe selloff just before bottoming, the 10-day put-to-call ratio jumped to a record 0.989. Investors were heavily seeking protection by buying puts back then.
Fast forward to now, sentiment has done a 360. Greed has overtaken. Last Friday, the 10-day average printed 0.431, essentially matching the record 0.43 reached on July 21. The pendulum has swung too far to the optimistic side. Unwinding will take place, timing notwithstanding.
Similar dynamics are in play in other measures of investor sentiment.
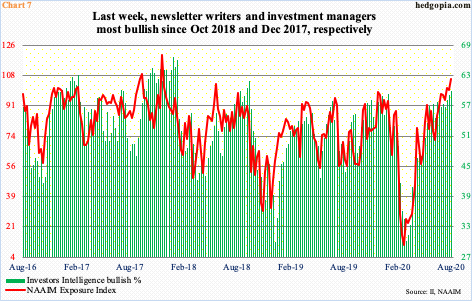
The NAAIM Exposure Index last week increased 6.43 points week-over-week to 106.56 (Chart 7). In its 14-year history, this metric has been higher only three other times – between September and December in 2017, right before a swift selloff in January-February the next year.
The index measures NAAIM (National Association of Active Investment Managers) members’ average exposure to US equity markets. These are professionals managing money for a living and are in equities up to the gills.
Also last week, Investors Intelligence bulls rose eight-tenths of a percentage point w/w to 60 percent, which was a 99-week high. This survey measures sentiment prevalent among newsletter writers.
As elevated as these sentiment measures are, they can always go higher, which is what the aggressive call-buying is hoping would happen. Immediately ahead, if VIX indeed goes lower toward 20, this may very well be the case, but reversal risks are very high in equities medium- to long-term.
Thanks for reading!
