
The S&P 500 large cap index finally breaks out of a box. Further building on it near term may prove difficult as the options market indicates investor sentiment is sanguine right now.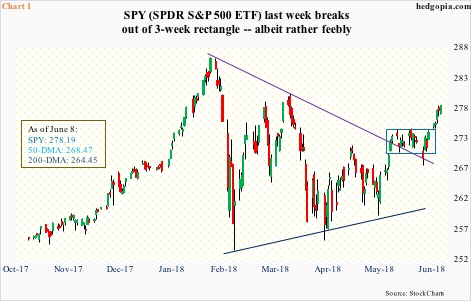
S&P 500 stocks made progress last week. After remaining trapped within a rectangle for three weeks, it began the week with a breakout, followed by continued upward pressure. For the week, the index gained 1.6 percent. SPY (SPDR S&P 500 ETF) was up nearly 1.7 percent.
From the intraday reversal low of $252.92 on February 9, the ETF ($278.19) has come a long way, although it is still below its all-time high of $286.63 on January 26, and is yet to break a pattern of lower highs. Last Thursday’s high of $278.28 is below the prior high of $280.41 on March 13, which of course was below the January high (Chart 1).
With last week’s breakout, bulls have gotten some momentum back. Time will tell if this is enough to push the ETF past the March high and toward the January high.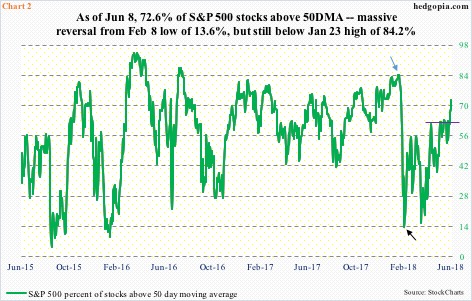
Last week’s rectangle breakout on the S&P 500/SPY accompanies a mini breakout in another metric.
The percent of S&P 500 stocks above the 50-day moving average struggled at the 61-62 percent since mid-April. It broke free Wednesday, with Friday at 72.6 percent. Once again, from a low of 13.6 percent (black arrow in Chart 2), it has come a long way, but is still below the January high of 84.2 percent (blue arrow). Will it test those highs? Tough to say.
Bulls readily point to the fact that there is plenty of room for this metric to rise before it reaches the 80s, which is where it has tended to peak historically.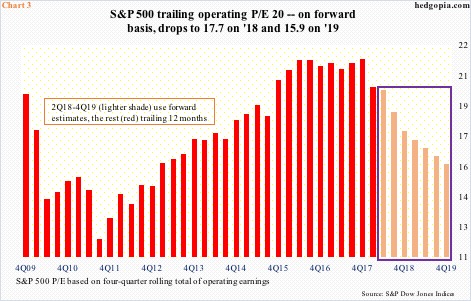
Here is the thing.
In recent weeks/months, large-caps have been left behind by their small-cap peers by a wide margin. The Russell 2000 small cap index surged past its late-January high three weeks ago, with successful breakout retest since. The Nasdaq 100 index joined the Russell 2000 last week as it rallied to a new high. The S&P 500 is still laboring under its late-January high.
This relative underperformance comes against the backdrop of extended multiples.
Using trailing 12 months of operating earnings, the S&P 500 traded at 20x at the end of last quarter. This is an improvement from 21.5x in 4Q17, but is still elevated. The picture of course changes if we use forward estimates.
Estimates for both this year and next took off as the Tax Cuts and Jobs Act of 2017 was passed into law on December 22. As of last Wednesday, 2018 estimates were $157.32 and 2019 $174.58, with the latter a new high while 2018’s peaked a month ago at $157.65.
Accordingly, using 2018 estimates, the P/E ratio contracts to 17.7x and further to 15.9x on 2019 earnings. This is still not cheap, particularly considering there is no certainty that these estimates will come through, particularly next year.
What made these multiples possible?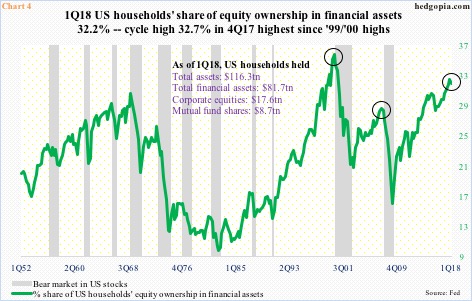
For one, US households are neck-deep in stocks. In 1Q18, they had 32.2 percent of their financial assets in equities. This is slightly under 32.7 percent in 4Q17, but much higher than the prior cycle high of 28.9 percent in 2Q07 (Chart 4).
Incidentally, this metric is one of those data points that both bulls and bears can spin to suit their own interests. Bears obviously see it as extended, which, truth be told, it is, but what is to say it can not get extended even more? During the 1999-2000 dot-com mania, this shot up to 36 percent in 1Q00. This is what the bulls are banking on, believing there is room for it to get crazier.
Regardless what transpires in the medium- to long-term, in the very near term there is room for the recent rise in investor sentiment to get unwound.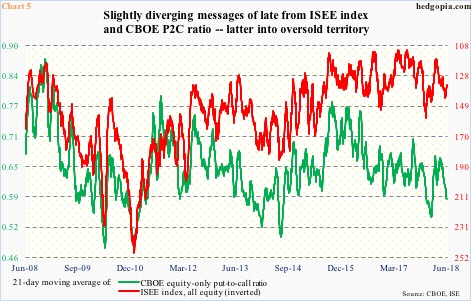
Chart 5 plots the 21-day moving average of the CBOE equity-only put-to-call ratio and the ISEE index, all equity.
Unlike the CBOE put-to-call ratio, the ISEE index is a call-to-put ratio (thus inverted in the chart), and excludes trades from market makers and brokers-dealers. It also only uses opening long trades.
Most recently, there has been some divergence between the two, otherwise the two move together. Of note in the chart is the rapid drop since mid-April in the CBOE P2C ratio. Last Friday, it was .582, just a touch higher than .581 on Thursday. Readings of mid-to-high-.50s signal elevated optimism. On January 26 when the S&P 500 peaked, it fell to .543 before bottoming.
In a scenario in which the outlook for SPY is neutral to slightly bearish near term, a hypothetical call calendar spread can serve the purpose.
SPY 280 long call calendar spread:
- Short June 15 at $0.61
- Long June 29 at $1.15
The spread costs $0.54, which is what is at risk. Ideally, the underlying goes sideways to slightly down this week, so the short option expires worthless and theta is captured, and rallies after that. Even better if implied volatility increases in the last two weeks.
Thanks for reading!
