Even as tech shorts have meaningfully increased their activity, Nasdaq 100 longs have tried to put foot down just under the 50-day. A takeout of the average can shift sentiment – duration notwithstanding.
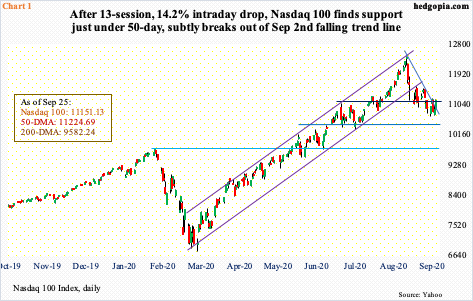
Tech bulls are trying hard to put foot down just under the 50-day. On the Nasdaq 100, the average was lost seven sessions ago. Earlier, the index (11151.13) peaked on the 2nd this month at 12439.48, up nearly 84 percent from March 23 when the February-March selloff ended. From that high through Monday last week, the index lost 14.2 percent. The drop is peanuts versus what was gained in the preceding five-and-a-half-month rally, during which several metrics got pushed into overbought territory.
Some of this selling was done by shorts who are positioned for continuation of the downward momentum. However, throughout last week, bids showed up at 10700-10800 (Chart 1). The 50-day lies at 11224.69. There has been a noticeable increase in shorts’ activity, and this probably is not lost on the bulls. Fuel for short squeeze is building.
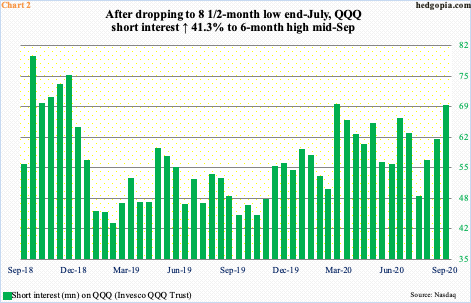
Mid-September, short interest on QQQ (Invesco QQQ Trust) increased 12 percent period-over-period to 68.3 million – a six-month high. Short interest has gone up for three consecutive periods, for cumulative 41.3 percent from end-July, and is comparable to the mid-March high of 68.5 million (Chart 2). Back then, shorts got aggressive even as stocks were getting ready to bottom and they were forced to cover. Tech bulls are hoping for a similar outcome.
Meanwhile, Nasdaq short interest rose 0.7 percent p/p to 9.48 billion mid-September, essentially on par with the end-June total of 9.51 billion, which was the highest since mid-September 2008. At the end of June, shorts got active even as the Composite, and other major US equity indices, was in the process of bottoming. Shorts were then forced to cover, to 9.11 billion mid-August (chart here).
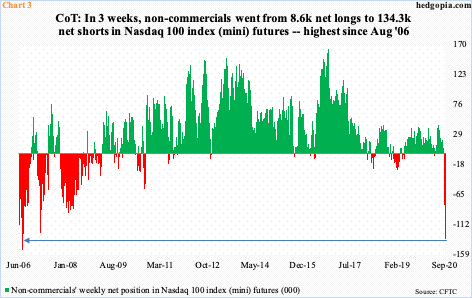
Tech shorts are also active elsewhere. In the futures market, non-commercials were net long 8,632 contracts in Nasdaq 100 index (mini) futures in the week to September 1. The index peaked on the 2nd, before coming under pressure. By Tuesday last week, these traders were sitting on 134,311 net shorts, which is the highest since August 2006 (Chart 3). So, within three weeks, they went from net long to aggressively net short.
Back then, the Nasdaq 100 began to come under pressure in April, bottoming in July. It then shot up nearly 55 percent through October 2007. Non-commercials, who were net short 151,506 contracts early August 2006 began covering and lent a helping hand; by mid-December, they were net long 56,203 contracts, and 76,731 by July 2007. Of course, once the Nasdaq 100 peaked in October 2007, it then collapsed north of 54 percent through late 2008/early 2009.
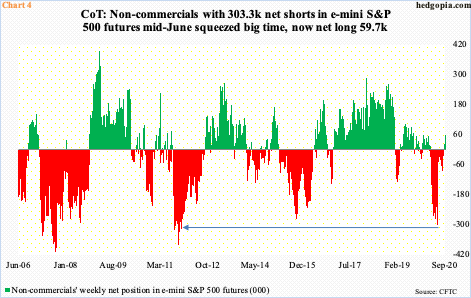
This phenomenon was also evident in e-mini S&P 500 futures in recent months. Mid-June, non-commercials were net short 303,305 contracts, which was the highest since November 2011 (Chart 4). As mentioned earlier, stocks bottomed late June, with bulls defending the 200-day several times on the S&P 500. As it ripped higher in subsequent weeks, non-commercials cut back, providing a tailwind to the rally. As of last Tuesday, they were net long 59,709 contracts. They have not been this long this year.
If their optimism pans out, the question is what might set off a rally?
Right here and now, the daily is oversold, although both the weekly and monthly have a ways to go before their respective overbought conditions are unwound. As far as the Nasdaq 100 is concerned, last Friday’s rally helped the index poke its head out of a falling trend line from the September 2nd high, closing right on horizontal resistance (Chart 1). Plus, it remains under the 50-day, reclaiming of which can act as a self-fulfilling prophecy – duration notwithstanding.
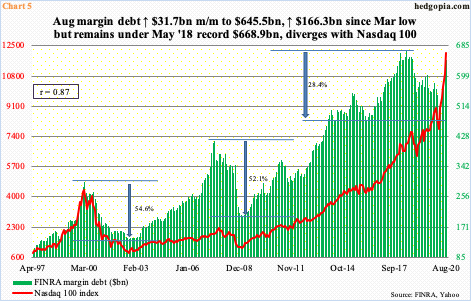
Perhaps encouragingly for bulls, at least through August, there has been an increase in traders’ willingness to take on leverage.
FINRA margin debt peaked as far back as May 2018 at $668.9 billion, diverging with stocks. Except for the Russell 2000, which peaked in August that year, other major US equity indices went on to rally to new highs.
Indeed, margin debt’s correlation coefficient going back to January 1997 with the Russell 2000 is 0.976, versus 0.873 for the Nasdaq 100 (Chart 5) and 0.925 for the S&P 500 (chart here). But from March, which is when they all bottomed, margin debt rose 34.7 percent to August’s $645.5 billion and the S&P 500 35.4 percent. Equity bulls should find the trend encouraging, notwithstanding the fact that this may have changed this month as stocks sold off.
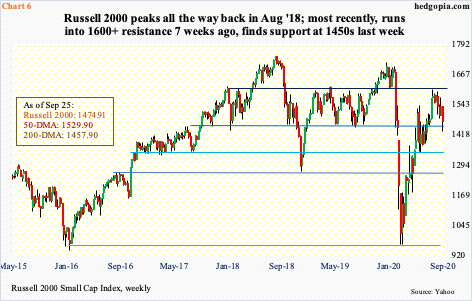
From the perspective of willingness to take on risk, it is recalling that small-caps have been laggards – and for a while at that. Small-caps inherently have larger exposure to the domestic economy and their outperformance – or a lack of it – reflects on the state of the economy.
As previously stated, the Russell 2000 (1474.91) is yet to surpass its August 31, 2018 record high of 1742.09. The closest it came was January 17 this year when the index tagged 1715.08 intraday, followed by 1698.91 on February 20, which was just before it unraveled (Chart 6).
The rally since the March low stopped just north of 1600-plus on August 11 – 1603.60, to be exact. This resistance goes back to January 2018. If there is any consolation for small-cap bulls, it is that support at 1450s-60s held last week. The 200-day at 1457.90 lies around there as well. A test of the 50-day will result in a 3.7-percent rally. A similar test on the S&P 500 is 1.6 percent away; on the Nasdaq 100, it is less than 0.7 percent.
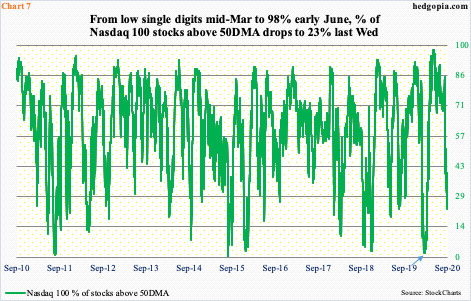
The 50-day is not considered as important as the 200-day, which many view as a make-or-break. But the 50-day does have the potential to shift sentiment. Should the Nasdaq 100 in particular reclaim the average, it would have come at a time when the percent of Nasdaq 100 stocks above the 50-day has unwound quite a bit of the overbought condition it was in.
Early June, 98 percent of these stocks were above the 50-day – a record – before dropping to 68 percent later that month. The index bottomed on the 29th, as did the green line in Chart 7, but the latter kept making lower highs even as the former ripped higher. The soldiers were increasingly falling behind the generals. The likes of Apple (AAPL), Microsoft (MSFT), Amazon (AMZN), Alphabet (GOOG) and Facebook (FB) were doing most of the heavy lifting. Whenever this happened, the generals have shown a tendency to eventually catch up with the soldiers, which is what happened this time around. Last Friday, except for AAPL, which barely closed above the average, the rest are underneath it. Wednesday, merely 23 percent were above the average, with Friday at 34 percent.
Several times in the past, this metric has reversed higher from the 20s, or teens, although there were times it dropped to single digits, which was the case in March (arrow). Shorts obviously are positioned for a latter scenario, meaning stocks continue lower until fear reaches extreme. At some point, the level of elevated shorts’ activity is bound to act as a tailwind. The only question is, does short squeeze begin right here or from a lower level? The 50-day has taken on extra significance.
Thanks for reading!

