After a three-week, 12-percent decline, the Nasdaq 100 staged a hammer reversal last Friday. In the right circumstances, there is room to rally on the daily. This can act as a self-fulfilling prophecy should tech bulls force zealous shorts to cover.

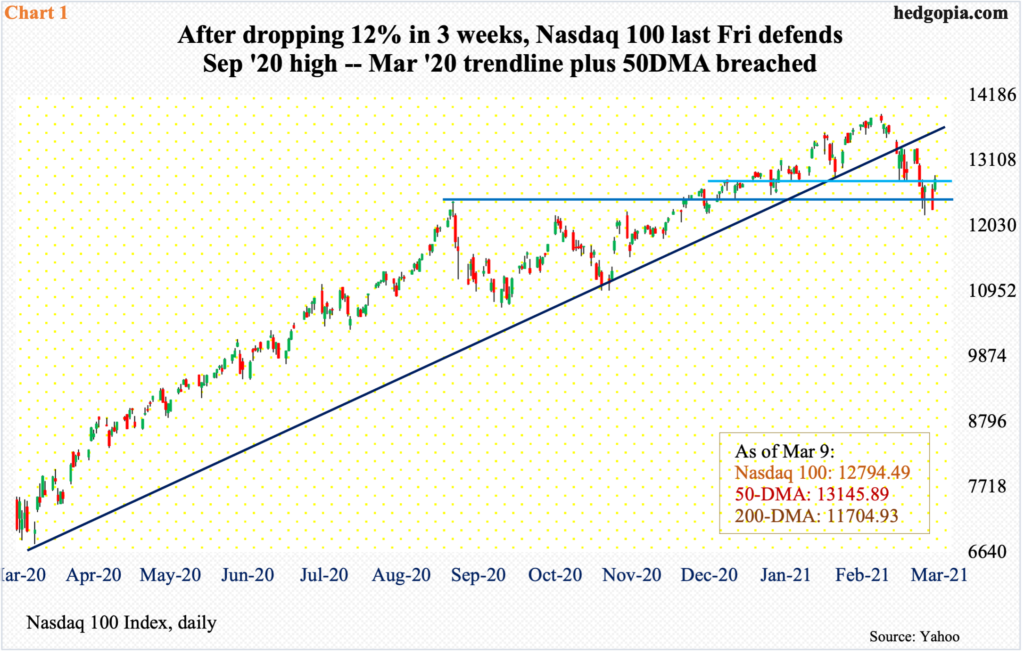
Last Friday, after dropping 12 percent intraday from its all-time high set on February 16, the Nasdaq 100 reversed with a daily hammer. The decline preceded a 105-percent surge from the low of last March – that is, in less than 11 months.
Even before the index retreated after the February high, subtle signs of distribution began to show up this year. Bulls were having difficulty hanging on to the gains. On the monthly, January formed a long-legged doji and February a shooting star.
The three-week decline has cost the index rising trend line from the aforementioned low of last March (Chart 1). Ditto with the 50-day moving average.
The consolation for tech bulls is that bids showed up last Friday slightly under the early-September high of 12430s, or right at the mid-October high of 12200s. Tuesday’s four-percent jump put the index right near short-term resistance at 12760s. The daily remains oversold. A takeout of 12760s opens the door to a test of the 50-day at 13145.89.
It is too soon to say if last Friday’s reversal is for real, because, of the major US equity indices, the Nasdaq 100 is the one to sustain the most technical damage. It remains under both the March trend line and the 50-day. But if the longs can regroup, they can at least benefit from a potential reversal of the positions accumulated by the shorts.

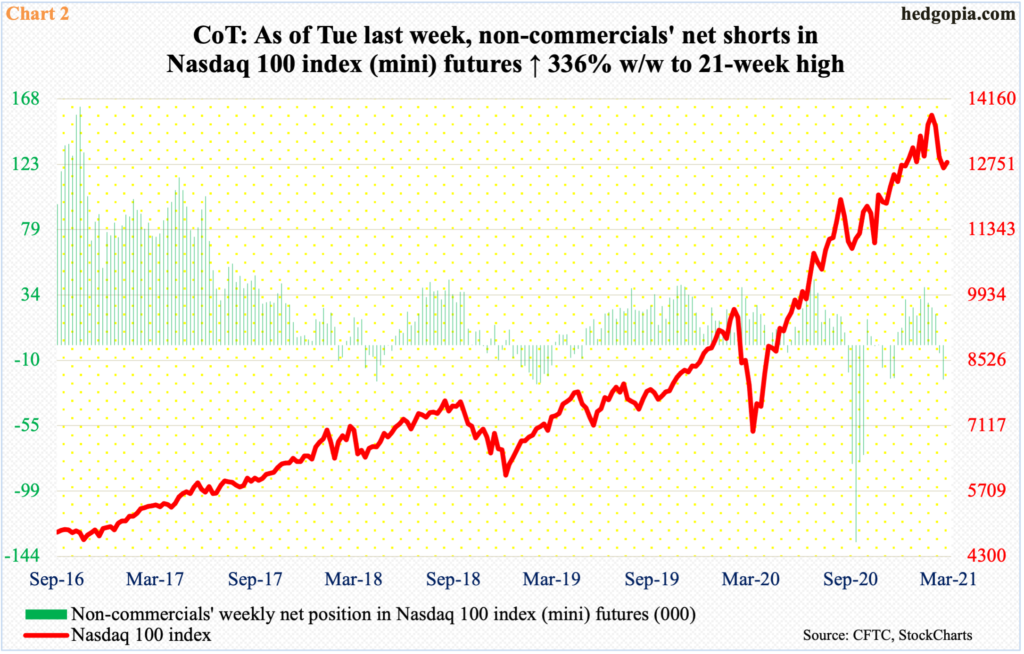
In the futures market, non-commercials as of Tuesday last week were sitting on 23,493 net shorts in Nasdaq 100 index (mini) futures. This was up from 5,388 contracts in the week before. These traders switched to net short after remaining net long for 11 straight weeks (Chart 2).
It is worth pointing out that in the week to September 22 last year, non-commercials were net short 134,311 contracts, a position so massive that once they began to cover it put sustained upward pressure on the cash. The current holdings are nowhere near that.
Thus, if tech bulls are unable to build on the action of the past three sessions, it is likely net shorts continue rising. This week’s reading will be telling as this will have captured Tuesday’s jump in the Nasdaq 100.

There are similar dynamics at play elsewhere.
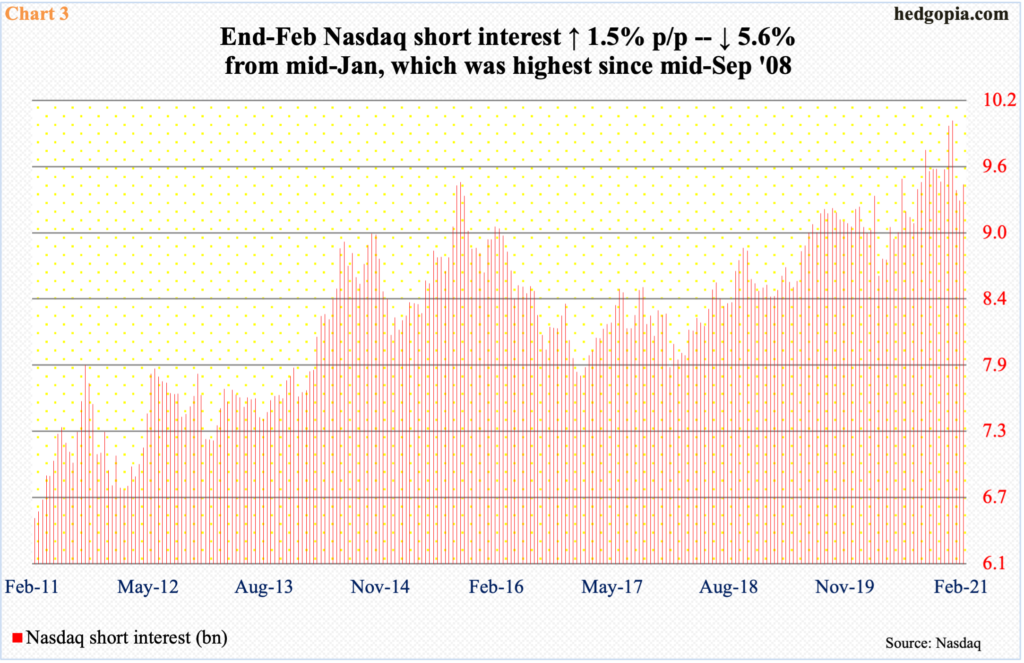
At the end of February, Nasdaq short interest rose 1.5 percent period-over-period to 9.45 billion. This is only 5.6 percent from the mid-January reading of 10.02 billion, which was the highest since mid-September 2008. In other words, short interest remains elevated (Chart 3).
On QQQ (Invesco QQQ Trust), in fact, end-February short interest surged 24.2 percent p/p to 84.98 million, which slightly exceeded the mid-February 2018 high of 84.64 million (chart here). Back then, after a little bit of back-and-forth, the ETF/Nasdaq 100 began to rally in April and kept on rallying until October.
Bulls would love a similar outcome. But for that to happen – or for a squeeze to occur – they need to hold last Friday’s low. Else, the 200-day can act as a magnet. They have an opportunity here. In the event they are able to regroup, shorts will be tempted/forced to cover. Immediately ahead, 12760s is the one to watch on the Nasdaq 100 (12794.49), with the corresponding level on QQQ ($311.77) of $311.
Thanks for reading!

