
- With massive inflows just last week, stocks need another to stay afloat
- With at least three important events on calendar, Jan can throw wrench in the works
- With stocks holding up amidst signs of preference for risk-off; opportunity to sell rallies for now
Stocks are sitting at a crossroads. Once again.
The past couple of sessions, action in the VIX has been nothing short of perplexing. Both Tuesday and Wednesday, it was getting bid up – at times aggressively – even as equities were trying to stay in the positive territory. Someone was seeking protection. SKEW (CBOE S&P 500 Skew index) was 134 on Wednesday, and has been in the 130s in 16 out of the 21 sessions in December (Chart 1).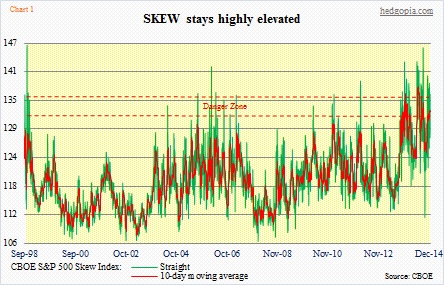
Action on Wednesday (S&P 500 down one percent) may or may not be indicative of things to come this month. There was just not enough participation. Volume was low. Price could easily overshoot or undershoot in such an environment. But then again, whoever sold, they were motivated sellers. They did not want to wait until the New Year. Bulls sure hope these are traders, who positioned early to take advantage of the December seasonality, and bailed out as the latter was a no-show. But if the Wednesday sellers are investors and still felt the need to get out regardless of tax ramifications, then that becomes important.
This is particularly so as technically December produced a spinning top (or a doji, however one looks at it) on the S&P 500. There is a doji on the Dow Industrials as well. And in semiconductors (SOX), materials (XLB), consumer staples (XLP), and industrials (XLI). One month does not make a trend, but this has shown up in the midst of a persistent uptrend in stocks. This can be taken to mean that the forces of supply and demand are in equilibrium. And that a shift in the direction of the prevailing trend could be at hand. The S&P 500 (2058.9) is bumping against the top end of a five-plus-year channel (Chart 2). Sellers can come out of the woodwork.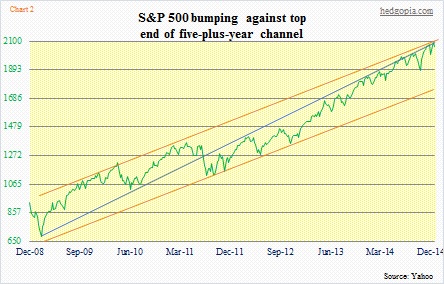
January is a month in which 401k money is – can be – put to work. Last year, it was at work in the first week; stocks were up. The remaining three weeks, sellers overwhelmed; January closed in the red. We just had massive inflows into U.S. stocks. A total of $39bn was put into U.S. stocks in the week ended December 24th – the biggest since Lipper started collecting data in 1992. ETFs attracted nearly two-thirds of that money. Nonetheless, as Chart 3 shows, mutual-fund flow activity was rather subdued leading up to November. The sudden pickup in flows have all the makings of investors seeking to preempt each other. The more a pattern or a seasonality becomes widely known, the higher the odds that it begins to lose efficacy, as front-running begins to take hold.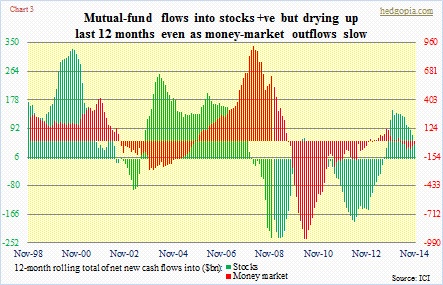
We may very well be seeing that in small-caps. The Russell 2000 was up nearly three percent in December. All the other major indices were down. Small-caps tend to do well in January. So is it a case of small-cap investors positioning themselves for this January phenomenon or there is something else going on? On a positive note, the Russell 2000 seems to want to break out of a sideways action it found itself trapped in for almost the entire 2014 (Chart 4). A convincing break out of this congestion would be significant. And that is exactly how small-cap bulls argue. The Russell 2000 had a great 2013 – up 37 percent. So it spent 2014 digesting those gains, now ready for another leg higher. Although that argument does not hold water. The S&P 500 too had a great 2013 – up 30 percent. But it did not feel the need to digest the gains. Given where we are in the cycle, small-caps’ relative underperformance probably is just that – underperformance in an environment in which offensive sectors are lagging.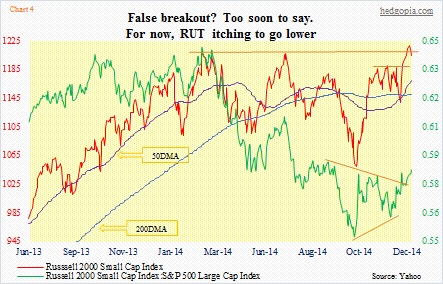
Risk aversion was rampant in 2H14. HYG (high-yield corporate bonds) was up nearly five percent in 1H but down nearly three percent in 2H, for a sub-two-percent return for the year. TLT (20+ year Treasury bonds) was up 10 percent in 1H and another 15 percent in 2H. As to ‘where to from here’, we might be looking at a couple of scenarios.
First of all, there are three important dates that we need to remain on top of this month: (A) Jan 22nd. That is when the ECB’s governing council has a monetary policy meeting. Needless to say, there has been a marked rise in investor optimism that Mario Draghi would announce some form of QE on that date. There have also been news items suggesting continued German opposition to it. We will see. If I were a betting person, I would say Draghi disappoints. (B) Jan 25th – the day the Greeks go to the polls. The elections may or may not provide answers to questions facing Greece – who wins, or whether or not any party would be able to form a government, or if the president has to call another election. Translation: uncertainty continues. And (C) January 27th-28th. The FOMC meets. There is a whole host of data ahead of that meeting, including the December jobs report and ISM manufacturing. If the Fed is serious about hiking this year, this would be the time to drop more hints before they act in earnest later.
Here are the couple of scenarios.
(1) Selling continues as January begins, and things begin to stabilize as we approach those three aforementioned dates.
(2) 401k funds help stabilize things at the beginning. In this scenario, the VIX will have a lot of unwinding left to do. This thing popped 21 percent just on Wednesday, and has surged 32 percent in three sessions. But even under this scenario, as we approach those dates – particularly (A) and (B) – selling can begin. And the longer (B) lingers, the more the pain. Almost no one has this scenario on his/her radar screen. Just look at the scant number of bears in the Investors Intelligence survey (Chart 5).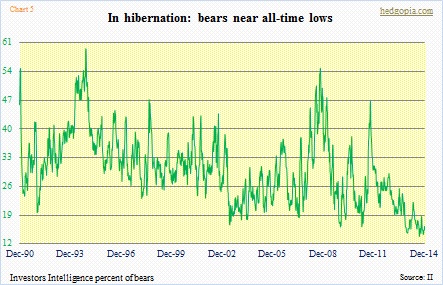
The bottom line: we are probably nearing a juncture in which rallies will be sold/shorted. For now.
