
Before large-caps were sold early May, traders were already gravitating toward risk-off. Stocks have rallied the past couple of sessions, but there are still no signs of full-on risk-on.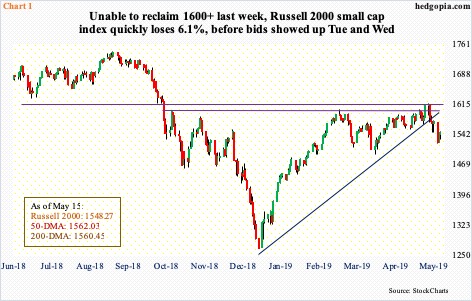
Eight sessions ago, on May 6, the Russell 2000 small cap index (1548.27) closed right at resistance just north of 1600. Going back to January last year, this level has acted like a magnet for both bulls and bears.
The rally from last December stopped on February 25 when the index retreated from 1602.10. Later, on April 29, it again backed away from 1603.08 (Chart 1). Small-caps – considered risk-on – were going through this rather sideways pattern even as large-caps continued higher. So, on Monday last week when it looked like the Russell 2000 was getting ready to break out, optimism rose that this would bring about a jump in risk-on sentiment.
Turns out there was a message in how small-caps were behaving. Large-caps began weakening as soon as May began. In six sessions through the intraday low this Monday, the Russell 2000 quickly lost 6.1 percent. The daily is oversold. Bulls put their foot down the last couple of sessions. But a sustained rally is anyone’s guess. The index lost both the 50- and 200-day moving averages, as well as trend-line support from the low of last December.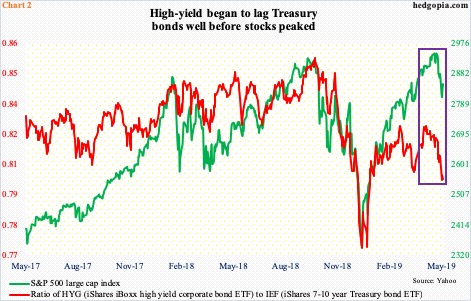
Charts 2 and 3 point to the same phenomenon – that traders/investors were taking risk off well before the latest bout of selling began early this month.
Chart 2 pits the S&P 500 large cap index against a ratio of HYG (iShares iBoxx high yield corporate bond ETF) to IEF (iShares 7-10 year treasury bond ETF). When traders are in a mood to take on risk, they gravitate toward high-yield, and vice versa. The ratio peaked at 0.827 on April 16, much earlier than the S&P 500 did. It bottomed this Monday at 0.801, as did the S&P 500, but at 0.802 Wednesday, it is essentially flat. This time around, the S&P 500 is trying to lead. Ideally, it would be healthier if it was the other way around.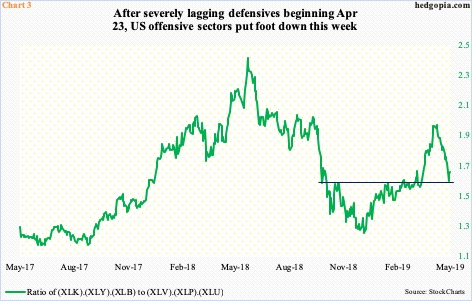
Similar dynamics are in play in offensives-versus-defensives.
In Chart 3, six SPDR sector ETFs are categorized under ‘offensive’ and ‘defensive’. XLK (technology), XLY (consumer discretionary) and XLB (materials) are treated as offensive sectors, and XLV (health care), XLP (consumer staples) and XLU (utilities) as defensive.
The offensive-defensive ratio peaked at 1.924 on April 23 – once again much earlier than major US equity indices did – bottoming this Monday. Bulls defended seven-month horizontal support.
The offensives are at an interesting spot. XLK and XLY in particular closed Wednesday right at the 50-day. A takeout of the average can add to momentum – duration notwithstanding. Then there is this. With two sessions to go, all three offensive sectors are down for the week. XLU and XLP, on the other hand, are up 0.2 percent are 0.3 percent respectively. XLU is near its all-time highs, XLP is not that far behind. There is a bid under the defensives, even though the ratio is trying to rally off of the afore-mentioned support. This will have to change. Else, the rally in equities the last couple of sessions will remain an oversold bounce.
Thanks for reading!
