
Last week, non-commercials went net long 10-year note futures for the first time since September 2014. For reference, they were net short north of 183,000 contracts as early as early May and 261,000-plus at the end of last December (Chart 1). So this is quite an about face in their sentiment.
In fact, back in September last year, these traders went net long only briefly – twice in a space of five weeks. The 10-year yield peaked at 2.64 percent in that month before coming under sustained pressure.
It is too soon to say if 10-year Treasury yields will face the same fate this time around.
But we do know this. The 10-year did try to take out resistance at just under 2.5 percent for several weeks before giving up two weeks ago. Yields are now down for two consecutive weeks.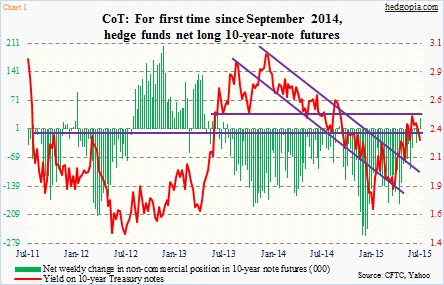
Bond vigilantes are simply not buying the message coming out of the FOMC – that a rate hike is coming later this year. The long end is also in disagreement with the short end. Of late, the latter is seeing upward pressure on yields, and seems to be buying into FOMC optimism about economic growth in the second half. Not the long end. Either it does not think the Fed moves this year or it is worried that a hike will end up hurting the already tentative U.S. economy.
Just to throw out a set of numbers, last week existing home sales in June were strong, whereas new home sales were a disappointment. Here at home, most data continue to be in the mixed to disappointing category.
If we focus on how commodities are behaving, they are painting a similar low-growth picture globally.
Amidst this, the iShares 20+ Year Treasury Bond ETF (TLT) has managed to repair the damage wrought on it earlier. Early June, it lost three-year support around 118, but then proceeded to find support at the bottom range of the January 2015 trend line. The subsequent month-and-a-half consolidation has resulted in the ETF rallying back above 118-plus (Chart 2).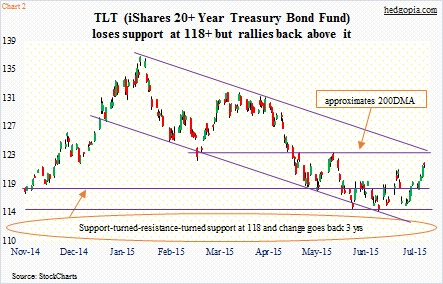
On a weekly chart, there is room for it to rally more. Although on a daily chart, conditions are beginning to get stretched a tad. In the past month, the ETF (121.39) has rallied just under six percent, and in doing so is back above the 50-day moving average (118.3), which is now beginning to curl up.
The 200-day moving average (123.19) is less than a couple of points away. Since it lost that average early May, TLT has not been able to stay above it. So if it gets there, odds are growing that it will pause for a breather. If nothing else, just to unwind daily overbought conditions. Can it get there? That will probably come down to this.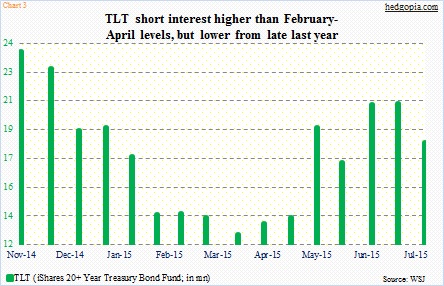
Short interest on TLT fell nearly 12 percent to 18.4 million in the mid-July period, but is comfortably above the levels of February through April. In the right circumstances, a mini squeeze can occur, and will probably test the 200-day under this scenario.
As things stand now, TLT is probably stuck in limbo between 50- and 200-day moving averages. A rally to the latter or a dip to the former can create short-term income-generation opportunities involving weekly options. Until then, it is worth waiting.
Thanks for reading!
Please keep in mind that this article was originally published yesterday (July 27th) by See It Market, where I am a contributor.
