
Once again, small-cap bulls defended two-year support on Russell 2000. Oversold momentum indicators are itching to move up. But there is no sign of full-on risk-on just yet. There is plenty of overhead resistance where bears are likely to get aggressive.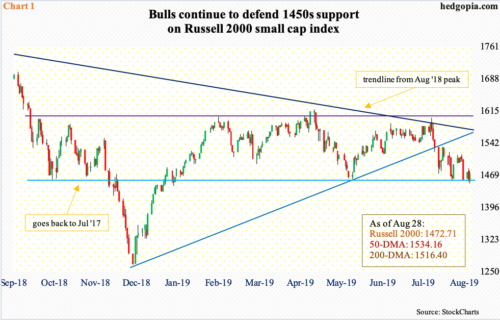
With two more sessions to go this week, small-cap bulls continued to defend important support on the Russell 2000. Wednesday, the index slightly breached the mid-August low intraday but ended up 1.2 percent when it was all said and done. Two-year horizontal support going back to July 2017 remains intact (Chart 1).
Oversold momentum indicators are trying to turn up on the Russell 2000. In the event of a rally – which is increasingly looking likely – there is plenty of resistance overhead. In the selloff early this month, the index (1472.71) suffered quite a bit of technical damage.
So far this month, the 200-day moving average (1516.40) rejected rally attempts several times. The 50-day (1534.16) is right above. After that lies resistance at 1560s, which represents a confluence of the underside of broken trend line from last December’s low and trend-line resistance from last August’s all-time high. The bottom line: there is no shortage of levels where bears can/will show up.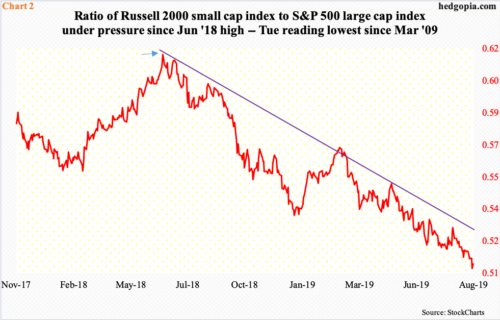
The thing to closely watch for now, among other things, is if the red line in Chart 2 can continue higher. It is a ratio of the Russell 2000 to the S&P 500 large cap index.
Typically, traders tend to gravitate toward small-caps in a risk-on environment, and vice versa. As noted earlier, the Russell 2000 peaked in August. The ratio peaked two months before that – in June (arrow), before proceeding to make a series of lower highs and lower lows. Tuesday’s low of 0.508 was the lowest since March 2009.
Needless to say, the ratio is suppressed. However, in and of itself, this does not mean it has to begin to rise. It will at some point, but it could be a while before that happens, as has been the case for over a year now. Hence the significance of how it behaves right here. Wednesday, the ratio ticked up to 0.510.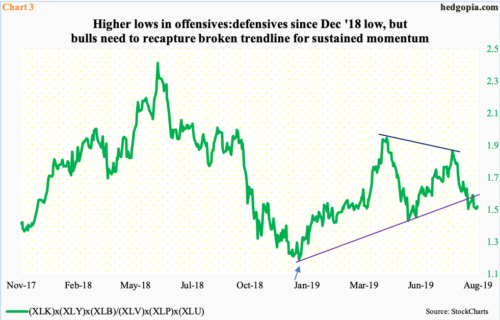
Chart 3 presents similar dynamics between risk-on and risk-off. Six SPDR ETFs are used to calculate a ratio between offensives and defensives. For this purpose, XLK (technology), XLY (consumer discretionary) and XLB (materials) are treated as offensive sectors and XLV (health care), XLP (consumer staples) and XLU (utilities) defensive.
Perhaps encouragingly – if it can be labeled as such – for equity bulls, the offensive-defensive ratio has made higher lows since last December (arrow). But even here, in the selloff this month, the trend line was breached, followed a week later by a rejection at the underside. The sooner bulls are able to recapture this trend line, the better. All the better if the downtrend in the small- large-cap ratio in Chart 2 gets broken, which takes place around 0.53. Until then, bears for sure will test bulls’ mettle by doing their best to show up at resistance.
Thanks for reading!
