
- Of late, momentum in U.S. sales of both new and existing homes
- Post-bubble burst, price has appreciated much faster than sales improvement
- Builders express optimism but are cautious in starting construction; inventory well-behaved
The upward pressure on U.S. home prices is driven more by supply than demand.
Lennar (LEN) reported its fiscal second quarter ended May yesterday. Results were better than expected. Home deliveries rose 21 percent year-over-year. Orders jumped about 18 percent from a year earlier, in line with 1Q’s gains.
LEN rallied nicely. However, for the third consecutive session this week, ITB, the iShares Home Construction ETF, failed to hold on to most of the early gains, but that is another story (more here).
LEN’s results are in agreement with the other two U.S. housing data published early this week for the month of May.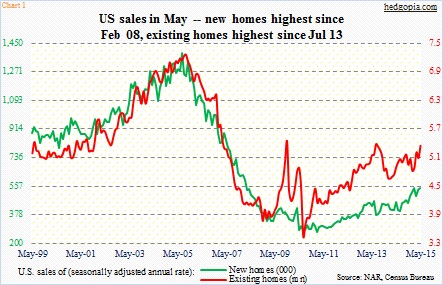
Sales of existing homes rose 5.1 percent month-over-month and 9.2 percent year-over-year to a seasonally adjusted annual rate of 5.35 million units – the strongest since 5.38 million in July 2013 (Chart 1).
Sales of new homes came in at 546,000 units (SAAR) – up 2.2 percent m/m and 19.5 percent y/y. They were the highest since February 2008. Sales for the prior three months were all revised higher.
Both these reports point to the prevailing momentum.
In a larger sense, however, sales remain tentative. If we ignore the sales spike during the bubble a decade ago, sales of existing homes are just back to 1999 levels. Since early 1999, the U.S. population has grown by 43 million, and there are 11 million more households. Similarly, the 12-month average of new-home sales in May was 482,000 units, matching the level of December 2008. In 2003-2006, new-home sales were north of a million units a year – we are talking bubble times. If we take an annual average between 1963 and 2002, 649,000 units were sold each year – higher than what builders have been selling currently.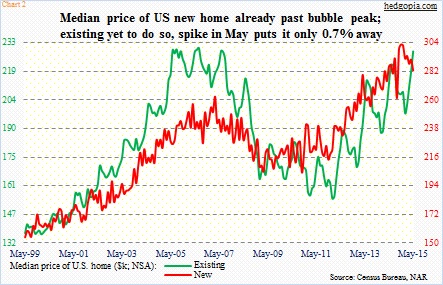
And then there is price, which is performing much better than sales. The median price of both new and existing homes has seen quite a recovery since it plunged after the bubble burst.
In Chart 2, the red line, represented by new homes, has already surpassed the bubble peak. Back then, the price of a new home peaked at $262,600 in March 2007. Last November, new homes sold for $302,700 – an all-time high (May was $282,800). For existing homes, the record was $230,400, reached in July 2006. In May, prices rose 4.6 percent m/m, to $228,700, merely 0.7 percent away from the 2006 peak.
It is obvious the spike in the price is not demand-driven. It is primarily coming from the supply side.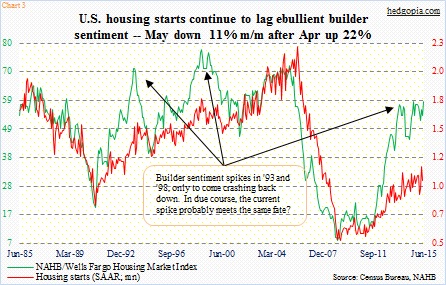
First of all, sentiment-wise, builders consistently remain optimistic. The NAHB’s Housing Market Index was 59 this month, matching the post-bubble high reached last September. At the same time, they are not putting money where their mouth is. Housing starts have far from followed the sentiment higher (Chart 3). May saw 1.04 million starts (SAAR), down 11.1 percent m/m. The recent trend is encouraging, though, with the 12-month rolling average in May of 1.03 million – the highest since September 2008. Nonetheless, starts have been weak versus where they have been in the past.
Hindsight is 20/20, but turns out builders cut back on starts in May even though the month produced good sales activity in both new and existing homes.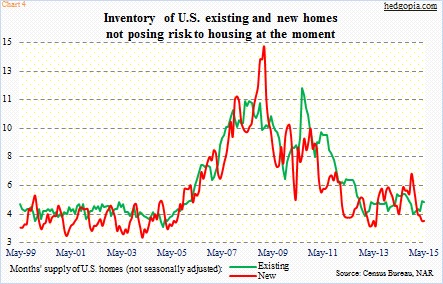
The result of all this is downward pressure on inventory of homes. At the current pace of sales, months’ supply in both new and existing homes is low – four and 5.1 months, respectively (Chart 4). For instance, there were 2.29 million existing homes in inventory in May, up from 1.86 million in January but down from 2.35 million last July; inventory peaked in 3.91 million in October 2007.
If there is any positive to this, it is that the risk to housing momentum may not be coming from inventory. Of course, if and when sales weaken, the months’ supply metric can/will rise fast. Nonetheless, as things stand now the risk comes from the recent spike in interest/mortgage rates as well as the rapid appreciation in home prices.
The 30-year fixed mortgage rate has jumped from 3.67 percent in April to 4.18 percent. This is quite a jump in such a short amount of time. Should it persist, housing will be hit with a double whammy. The rapid rise in price has already been a headwind – pricing out many a potential buyer.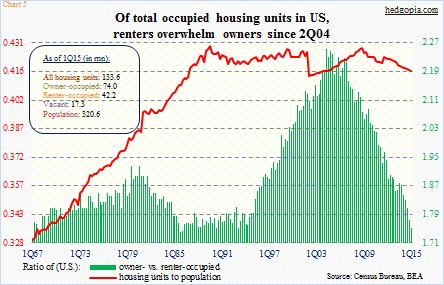
In Chart 5, the green bars represent a ratio of owner- to renter-occupied units in the U.S. Since 4Q04, the ratio has come under persistent pressure. Back then, there were 74.4 million owner-occupied units and 33.1 million occupied by renters. In 1Q15, this stood at 74 million and 42.2 million, respectively. That is 10 years of treading water as far as ownership is concerned. This is also reflected in the homeownership rate, which in 1Q15 dropped to 63.7; the last time it was this low was in 1Q93.
The rapid appreciation in price does not help, which in turn is not getting any help from the inventory situation. In Chart 5, the red line takes the ratio of all housing units to the nation’s population. It peaked a long time ago – in 3Q89. The most recent peak came in 4Q08, and has been under pressure since. Hence the crunch from the supply side, and the resulting upward pressure on price, even though demand is nothing much to write home about.
Thanks for reading!
