
For the second consecutive year, U.S. stocks are struggling to get traction in December. Month-to-date, the S&P 500 large cap index is down 0.9 percent. December last year was down 0.4 percent. In fact, before trading began last week, the index was in a much deeper hole. But the 2.8-percent rally last week significantly cut the monthly loss (Chart 1).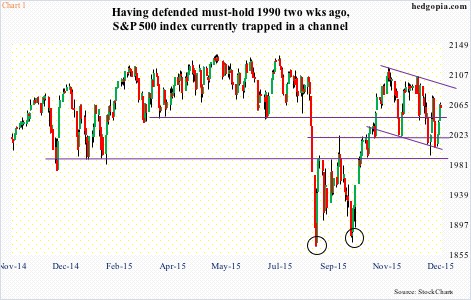 The question is, will the momentum continue this week, or December this year will end up following in the footsteps of last year’s? In the very near-term, there is room to rally. Daily overbought conditions still have room left for unwinding. Daily MACD is about to cross up. That said, with last week’s rally equity bulls will have to deal with an S&P 500 (2061) that is sitting right on its 50- and 200-day moving averages (2064 and 2061, respectively). Should stocks continue to get bid up, the level to watch lies around 2090, which makes up the upper end of the channel the S&P 500 is in. A clean breakout has the potential to draw on-the-sidelines money.
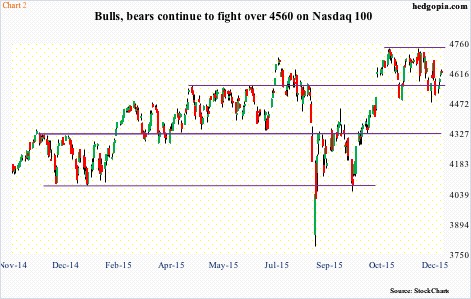 Similarly, on the Nasdaq 100 (4623), the all-time high early this month is merely 2.5 percent away. The 4560 level on the index has proven to be an important price point since April last year (Chart 2). Last week’s rally not only put it north of that resistance as well as its 50-day moving average (4618); the 200-day moving average (4470) lies underneath. Bulls need to be able to defend the 50-DMA. On the S&P 500, should last week’s momentum falter, 2040 is where bids likely show up. At least the bulls hope so… after that is 2020, followed by a must-hold 1990. In the middle of this month, buyers did defend the latter resistance. This is the near-term picture, and as things stand, it could essentially go either way. Medium-to long-term, bulls probably have their work cut out. First and foremost, flows are not cooperating.
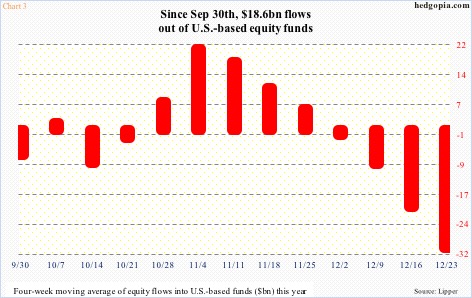 Chart 3, using a four-week moving average, plots flows into U.S.-based equity funds since September 30th. On September 29th, the S&P 500 successfully tested the August lows (circles in Chart 1), before getting on a powerful rally. Hence that date is a good reference point to use in regards to inflows, or a lack thereof. In this case, they are acutely lacking. In the week ended last Wednesday, another $7.6 billion exited these funds. In the past three weeks, north of $29 billion was withdrawn. And since September 30th, a total of $18.6 billion has left. Also using the August lows as a reference point, we learn that the subsequent rally did not come on the back of an increase in margin debt, which has since essentially gone sideways – $473 billion in August, $454 billion in September, $472 billion in October, and $473 billion in November.
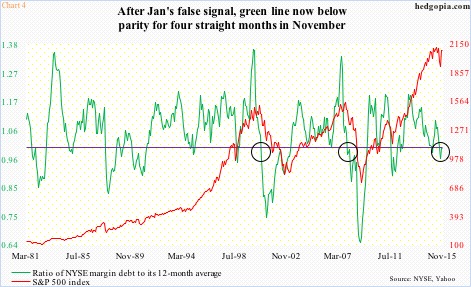 Rather, this particular metric could very well be on the verge of an inflection point. Chart 4 plots the S&P 500 against the ratio of NYSE margin debt to its 12-month average. The green line below one suggests waning momentum in margin debt. Once it drops below parity and sustains, stocks tend to suffer. This phenomenon preceded last two bear markets (circles in the chart). Currently, the green line has been below parity for four straight months, albeit slightly. Then we have earnings, which at this point in the cycle have become more a headwind than a tailwind. Third-quarter operating earnings of S&P 500 companies were $25.44, down from $29.60 last year. For the fourth quarter, current estimates are $28.94, versus $26.76 last year, but have been persistently under pressure. At the end of 1Q14, 4Q15 estimate was $36.95. Ditto with 2015, which has been revised down to $106.32 now from $137.52 at the end of 2Q14 (Chart 5).
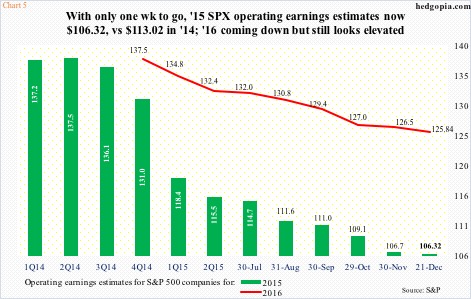 The downward revision trend has continued in 2016. As early as February this year, next year was expected to come in at $137.50 – now $125.84. Earnings are expected to grow north of 18 percent next year. This year, if 2015 estimates are met, they would have dropped nearly six percent over 2014. Momentum is clearly decelerating, and several things have to go right so 2016 estimates are realized, including acceleration in the economy, trend reversal in both crude oil and the dollar, among others. The dollar in particular has rallied strongly since July last year, hurting multinationals/exporters. Not to mention prices of commodities. The US dollar index primarily rallied pricing in traders’ interest-rate expectations. With the rise in fed funds this month, futures traders are forecasting two more hikes next year, even as the FOMC’s dot plot is looking for four quarter-point hikes. In the latter scenario, the greenback probably continues to rally. This, however, is not a scenario with high odds. Throughout this cycle, the Fed has consistently been overestimating growth/inflation prospects. As well, the long end of the Treasury yield curve continues to attract bids.
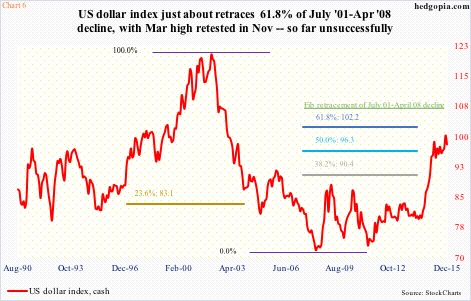 Indeed, the dollar index has just about retraced 61.8 percent of the July 2001-April 2008 decline – always a good spot for pause/trend reversal. As well, the November high sought to take out the March high, and failed. (Chart 6 does not quite capture this as it is a monthly chart.) The ‘dollar at a probable inflection point’ scenario also fits well looking at how non-commercials are positioned in the futures market. They were net long back in March and net long in November, although with substantially fewer holdings when the index was testing the March high. Having been a group that in the past have ridden the ups and downs in the dollar well, they substantially lack the aggression they showed back in March (Chart 7).
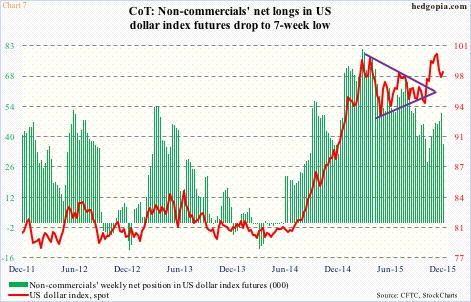 If this is a sign of an impending dollar peak, come 2016 this can amount to a tailwind for a whole host of things including commodities, exporters, and 2016 earnings. This is as good a scenario as any equity bulls can hope for. Although they will still have to deal with a maturing economy, elevated inventory, decelerating earnings, and what not.
Either way, the medium- to long-term outlook for stocks is probably destined not to be a smooth sailing, with plenty of trading opportunities for the nimble ones, as was the case this year. Thanks for reading!
