
Late last year as the Federal Reserve was unwinding quantitative easing (QE), there was suspense in the air as to how this might impact U.S. stocks. Bulls argued QE was never a factor in stocks’ surge, rather earnings were. Bears would point to Chart 1, which showed a clear correlation between the two. Stocks rose during QE1/2/3 and had a nervous breakdown as soon as QE1/2 ended.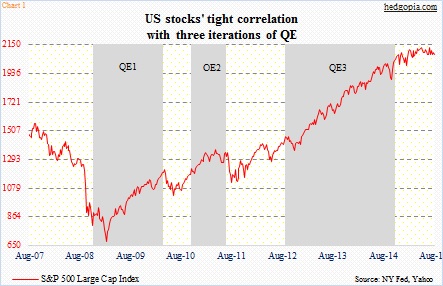
Hence investor unease when QE3 ended last October. As it turns out, stocks did just fine. As a matter of fact, they kept rising. The S&P 500 Index, for instance, only peaked in May; the past three months, it has lost its mojo – playing ping pong between 2040 and 2130.
This is coming at a time when earnings are decelerating. Consensus estimates for S&P 500 operating earnings this year are no longer slated to grow year-over-year. As of August 13th, estimates have been slashed to $111.88. Last year, they were $113.02. This would be the first drop since 2008. At $131.34, next year’s estimates have come down a little but continue to be optimistic. For reference, at the end of 2Q14, 2015 estimates were $137.52 (Chart 2)!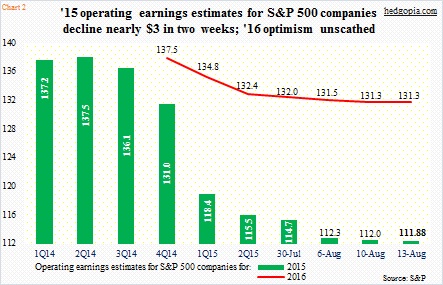
The other day, the Bank of America Merrill Lynch’s latest global fund manager survey showed fund managers’ overall exposure to U.S. stocks stood at a 14 percent net underweight position – marking the sixth straight month they were net underweight the U.S. stock market. The question is, if they have stayed out all these months, would they be willing to get in now, especially when earnings are in deceleration? They are probably waiting for a correction.
This is important.
Foreigners have been net sellers of U.S. equities. Chart 3 plots the S&P 500 Index with the 12-month rolling total of foreign purchases of U.S. equities. They peaked in April 2013, and went negative in November that year. In the past, the green bars and the red line have tended to follow each other. This has not been so the past couple of years. Other sources have stepped in.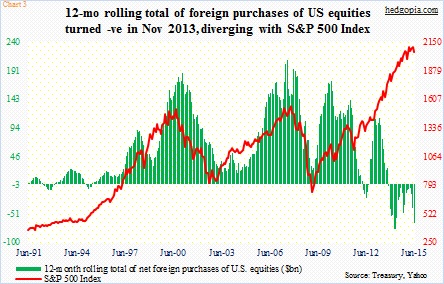
Margin debt is hanging in there. In June, it rose 1.2 percent month-over-month to $505 billion, just below the all-time high of $507.2 billion in April. The 12-month rolling average in June was $471 billion, also an all-time high. The green line in Chart 4 takes a ratio of the 12-month moving average of NYSE margin debt to margin debt. In the past – particularly the previous two bear markets – once the ratio sustainably remained under parity, it brought bad news to stocks. This past January, the ratio slid to 0.979, but only to come right back up, as margin debt began to rise again.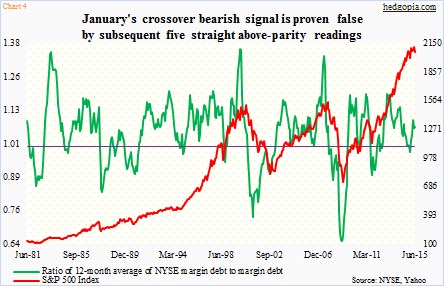
Besides margin debt, buybacks have been the most reliable source of buying power, particularly the past five years.
Chart 5 divides the current bull market into three 500-point increments using the S&P 500, focusing on contribution from different sources of funds. During the March-December 2009 period, money-market funds shrank by $586 billion, even as foreigners purchased $154 billion in U.S. stocks, margin debt went up by $58 billion and share buybacks (S&P 500) equaled $107 billion. In the January 2010-April 2013 period, contribution from each of these rose even more. Since May 2013, however, things have changed. Money-market funds have only dropped by $7 billion, even as foreigners have been net sellers of U.S. stocks. Margin debt continues to grow, but the intensity is less than during the January 2010-April 2013 period. The violet bar is the only one standing out tall. Hence the risk.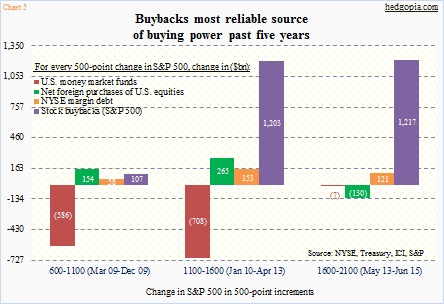
S&P points out that in the first quarter buybacks and dividends surpassed 100 percent of operating earnings of S&P 500 companies – $228.4 billion in operating earnings versus $144.1 billion in buybacks and $93.6 billion in dividends. For the five quarters through 1Q15, more than 20 percent of S&P 500 constituents reduced outstanding shares by at least four percent from a year ago.
Viewed from this perspective, Chart 2 is apropos. The deceleration in the green bars is a warning sign that the buybacks we have seen the past five years (Chart 5) are probably not sustainable. Stocks increasingly will need new sources of buying power to maintain the upward momentum. A lack thereof will change the supply/demand dynamics for stocks – a risk in the medium- to long-term.
Thanks for reading!
