
Last week, both VIX and the S&P 500 declined. Ordinarily, the two are negatively correlated. This took place even as the volatility index is finding it difficult to enduringly stay above 32-33.
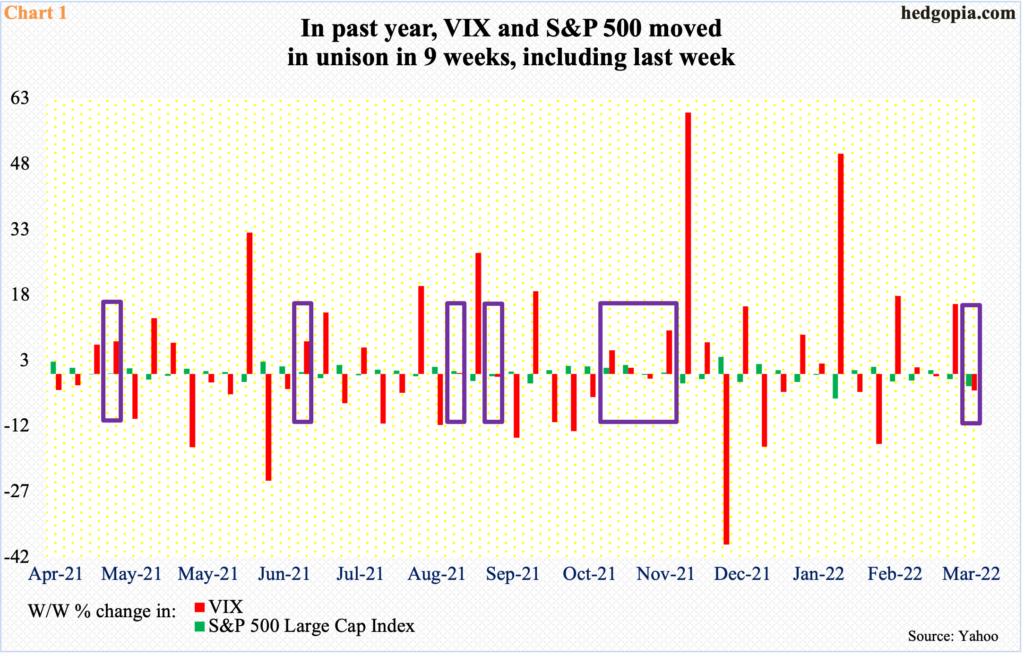
Last week, VIX and the S&P 500 moved hand in hand, which is a rare occurrence. The former dropped 3.9 percent and the latter 2.9 percent.
The volatility index, which is a measure of market estimate of 30-day volatility, is derived from the prices of S&P 500 index options. Ordinarily, the two tend to move in opposite direction. Last week’s correlation was the ninth such occurrence in the past year (Chart 1).
This is taking place at a time when VIX continues to struggle to stay above 32-33.
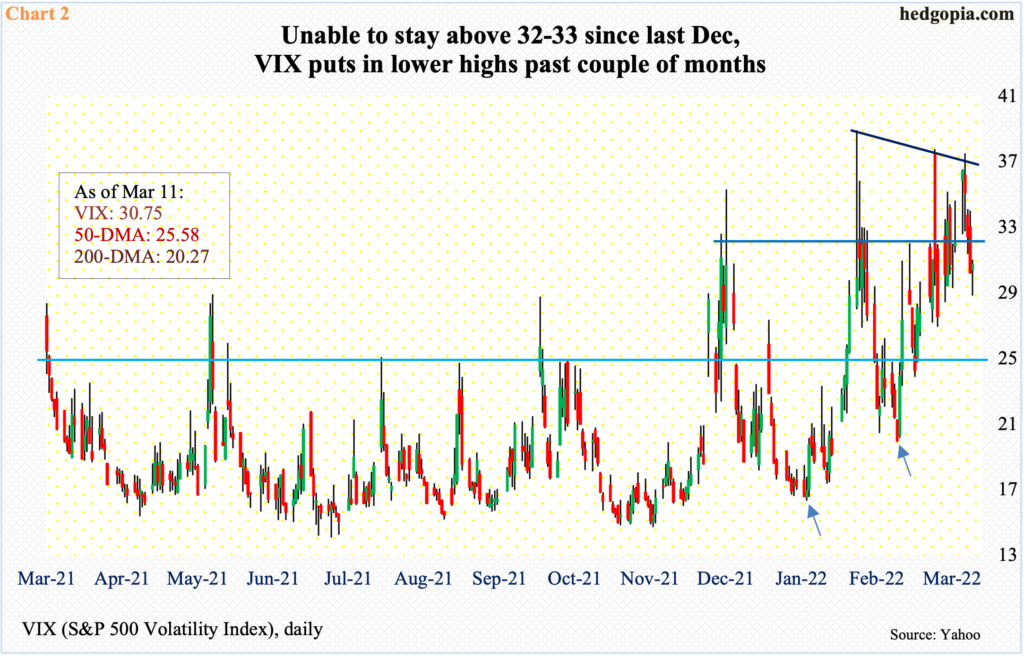
The volatility index has printed higher lows for a while now, with the most recent in early January and a month after that (arrows in Chart 2).
From early January when VIX bottomed at 16.34 on the 4th through 38.94 posted on the 24th in that month, it more than doubled. Since that high, it has made lower highs – 37.79 on February 24 and 37.52 last Tuesday.
Throughout all this – even going back to early December last year – VIX (30.75) has struggled to stay above 32-33.
For now, the daily seems to want to go lower. In this scenario, there is support at mid-20s, and low-20s after that.
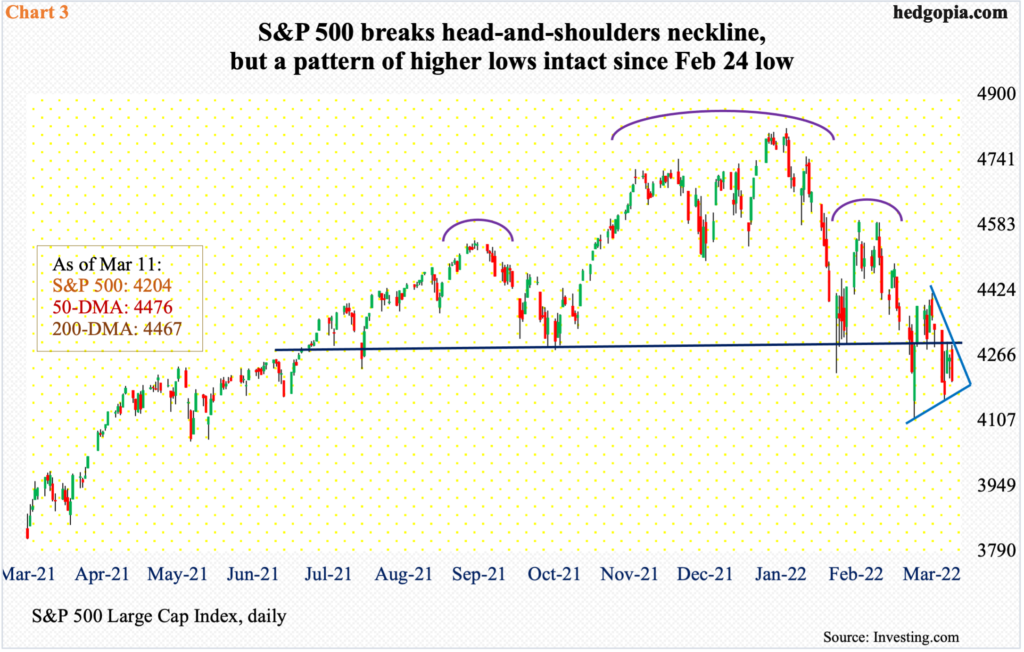
In the meantime, the S&P 500 has broken the neckline of a head-and-shoulders pattern, which is not very clean, but it is there. Sellers showed up last Wednesday and Friday right at the broken neckline (Chart 3). The break probably is not decisive yet. Else, it could eventually open the door toward 3600.
Amidst this, bulls can take solace in the fact that there is a pattern of higher lows since the February 24 low of 4115, through which the S&P 500 dropped 14.6 percent from the January 4 record high of 4819. Last week, the large cap index closed at 4204, having earlier dropped to 4158 on Tuesday.
A rising trend line from last month’s low gets tested at 4180s. Reclaiming of 4300, which is about where the 10-day moving average lies, will give bulls momentum in the near term. By then, the 10- and 20-day should have at least begun to flatten out.
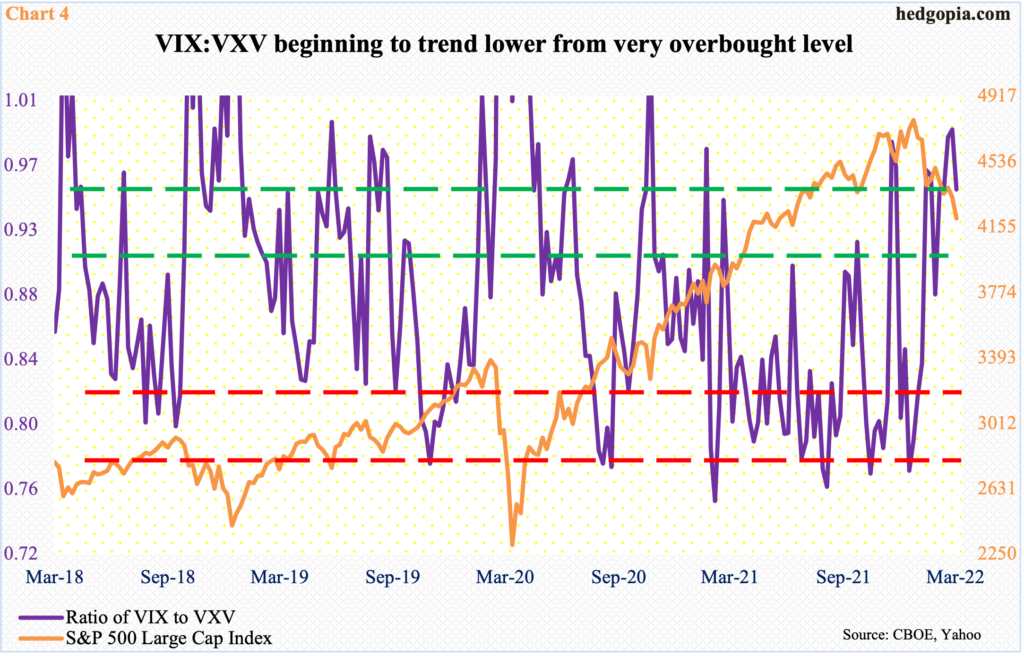
In the event investor mood shifts to risk-on – duration and magnitude notwithstanding – demand for nearer-term protection should dissipate. In this event, the ratio of VIX to VXV has tons of room to go on the downside before the overbought condition it is in gets unwound.
VIX measures market’s expectation of 30-day volatility on the S&P 500. VXV does the same, except it goes out to three months. When investors are in risk-off mode, demand for VIX goes up more. The opposite occurs when sentiment goes the other way.
Last Friday, the ratio ended at 0.95. This was the fifth week in a row – and seventh in the last eight – the ratio closed in mid- to high-0.90s; it remains in overbought territory. Unwinding of this should help stocks in general and the S&P 500 in particular.
Thanks for reading!
