
- VIX looks to be setting up to move higher near-term
- Medium-term technicals halfway through unwinding overbought conditions
- Long-term, potentially saucer bottom in making, could be headed a lot higher in months to come
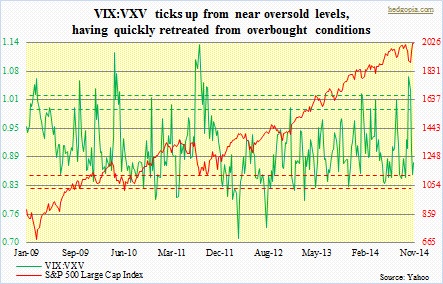 Last Friday, even as all the major U.S. indices gapped up in the morning, staying strong through the afternoon and closing strong, market participants were also buying protection. The VIX held up well throughout the day, except the last hour when it got dumped. It was a subtle change in sentiment nonetheless. (By the way, the CBOE equity put-to-call ratio printed a rather complacent 0.5 on that day.) Of late, the so-called fear index has had quite a roller-coaster ride – from 12-plus on September 19th, the day the S&P 500 Large Cap Index peaked at 2019 before sliding nearly 10 percent, to north of 31 on October 15th, the day the S&P 500 troughed at 1821 before rallying 11 percent, to just under 15 yesterday. So in six weeks, the S&P 500 has had two 10-percent swings, and the VIX more than doubled only to give it all back. With one difference. Even as the S&P 500 (2017.81)has managed to print a new high, the VIX (14.73) has so far refused to make a lower low. It could be because technicals are oversold in the near-term, or there is more to it. For now, it just feels like the volatility index wants to go higher. The VIX to VXV ratio, after having quickly retreated from a month ago, is attempting to hook up from oversold levels.
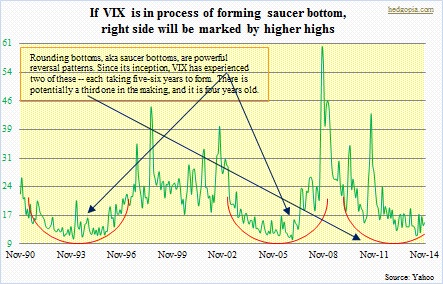 The question is, if volatility is setting up to move higher near-term, how would that then change the intermediate picture, if at all? Overbought technicals in this time frame have more unwinding left still, but are also at a crucial level. Indicators such as stochastics, CCI and RSI are smack in the middle of the range, and these things can/do turn back up from these levels. Interestingly, on a multi-year chart the index looks to be forming a saucer bottom. These are patterns that signal a shift from a downtrend to an uptrend. As shown, there have already been two such bottoms, each taking five to six years to form, followed by a spike higher. (Monthly closing prices are used in the chart, not intra-day. In October 2008, the VIX spiked to just under 90.) If it is indeed a saucer in formation, then the left half and the bottom are in place. For the right half to form, the VIX should be progressively making higher lows/higher highs. From this perspective, if the higher low this week holds, this could be an interesting development. Particularly so considering that the S&P 500 is now back above both its 50- and 200-day moving averages.
Immediately ahead, more telling would be how volatility rises and how far it goes.
