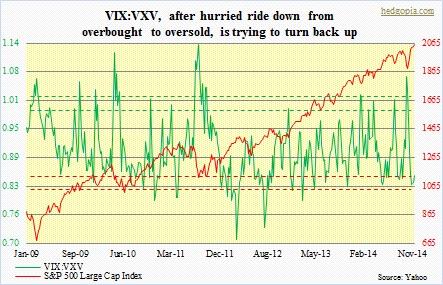
- VIX:VXV itching to move higher, which could put stocks under pressure
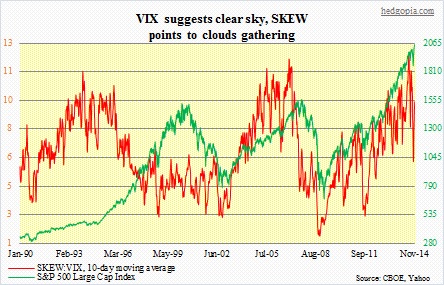
- VIX suggests calm, but SKEW points to institutions buying tail-risk protection
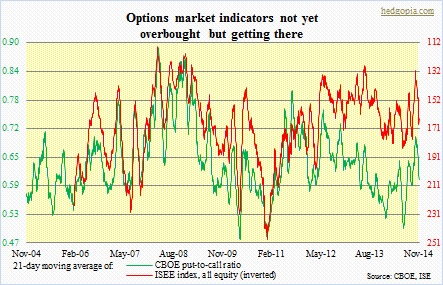
- Put-to-call ratios have had extreme readings past several sessions on both CBOE, ISE
The S&P 500 Large Cap Index is on track for a fifth consecutive up week. Implied volatility has been crushed. VIX in the 13s could not be any clearer. There is calmness in the air. A look at the SKEW, and one gets a slightly different impression. The latter measures the difference between at-the-money and out-of-the-money option premiums on the S&P 500, whereas the VIX measures at-the-money front-month premiums. A higher SKEW indicates that more institutional hedging is taking place under the surface. That is what a higher SKEW:VIX suggests – currently at 10, up from 4.4 on October 15th. As stocks bottomed that day, the SKEW index dropped to 111 from 146 on September 19th, when the S&P 500 peaked before dropping nearly 10 percent. The reading yesterday was 136, with the 10-day moving average at 129; the latter has been gradually rising for the last two weeks. In other words, the cost of protecting against a tail event has been rising. Stocks tend to get into trouble when this average reaches and lingers in the mid- to high-130s. If this pattern holds, it could be several more days before this happens.
There is a similar message coming out of put-to-call ratios. Straight readings the past several sessions have been bordering on the extreme. Five out of the past six sessions, the CBOE put-to-call ratio has had readings in the 50s, with one in the 40s. Over on the ISE, their all-equity index had three consecutive readings over 200 on the 12th-14th. But the 21-day moving average, which is what we use here, is yet to get to levels that indicate extreme complacency. Here is the thing, though. Because of the most recent readings, these averages are likely to continue to head lower in the next several sessions (ISE is a call-to-put ratio, hence inverted in the chart). A more reliable signal to go short would come from a lower level.
Technically, stocks are obviously overstretched in the short- to medium-term. The VIX to VXV ratio is itching to move higher. As stated earlier, the VIX measures implied volatility as determined by 30-day S&P 500 options. The VXV does the same but provides a three-month vehicle. So a lower ratio between the two means traders are selling more of the former than the latter. From a contrarian perspective, that will be the time to go long one-month volatility. If front-month volatility does indeed pick up, then the ratio rises, and that brings bad news for stocks. After a rather hasty journey down beginning early October, it is now beginning to hook up.

