Volatility is creating a lot of buzz these days. There is none of it – both implied and actual.
Bulls are hurting.
Year-to-date, UVXY (ProShares ultra VIX short-term futures ETF) is down 71.6 percent, and VXX (iPath S&P 500 VIX short-term futures ETN) is down 44.8 percent. VIX (10.60) is down 24.5 percent.
This is near-term. Medium-term, there is hope. Hopefully – for volatility bulls, that is.
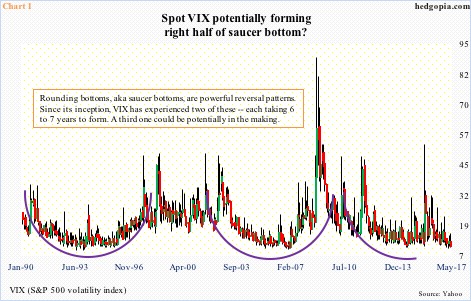
Chart 1 is a monthly chart of VIX going back to February 1990, when it began its life. A pattern can be noticed.
Over a period of six to seven years, VIX tends to complete what among technicians is known as a rounding-bottom formation, during which the right side is formed as volatility spikes. Thus far, two have completed. It is possible a third is in the making.
That said, right here and now, volatility has gone missing.
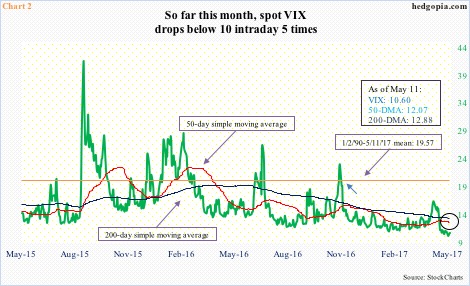
Month-to-date, VIX closed sub-10 twice, and dropped below 10 intraday five times.
The last time VIX closed above its long-term average was just before the presidential election last November (blue arrow in Chart 2). Since then, for the most part, risk-on took over, and volatility got slammed.
In fact, VIX has remained suppressed for so long the spread between 50- and 200-day moving averages is less than a point. Both these averages are now slightly dropping to flattish.
In the right circumstances, it does not take long for these averages to forge a golden cross – potentially a bullish development for volatility. But no one is betting on that outcome now.
VXX shorts have been aggressive, and, kudos to them, they have been spot on.
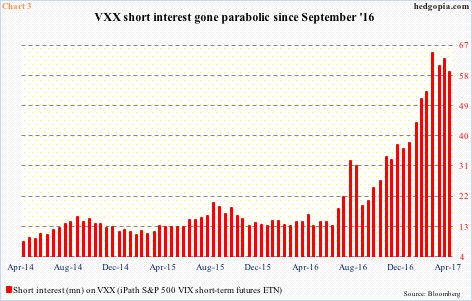
Short interest on VXX began to go parabolic last September – more than tripling in six months (Chart 3). The all-time high of 64.6 million was reached mid-March, with end-April at 58.9 million.
In due course, this elevated level of short interest can act as fuel for squeeze. The problem is that one could have made the same argument a month ago, or two, or three.
We do know this.
Mean reversion is a common phenomenon. VIX is not an exception. As things stand, VIX has to nearly double to get to its 27-year mean (Chart 2). That is how suppressed it is.
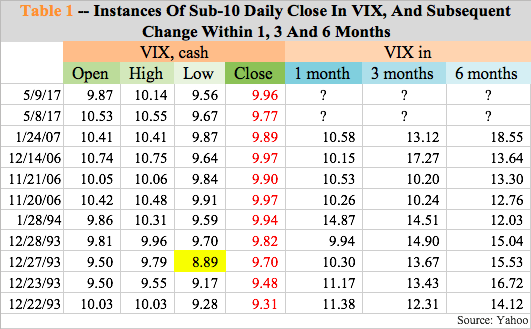
The back-to-back sub-10 close this week on Monday and Tuesday is not a common occurrence. Hardly. Prior to this, throughout its history, VIX closed in single digits nine times (Table 1). (The all-time low of 8.89 was recorded on December 27, 1993.)
Now, here is the interesting part.
In each of these nine instances, VIX was higher one or three or six months afterwards. Without fail. These odds favor volatility bulls.
Hence, regardless the right half of the saucer-in-the-making in Chart 1 gets completed or takes time to do so, if past is prologue, Table 1 points to increase in volatility in the weeks/months ahead.
Thanks for reading!

