
US equities sold off Tuesday – apparently in reaction to higher-than-expected CPI readings for January. The consensus may have expected better prints, but the fact remains that last month’s y/y change was better than December’s. The disinflation trend is intact. Reason behind the selloff? Equity indices, which remain extremely overbought, may now be looking for a reason to weaken.
In January, headline and core CPI (consumer price index) respectively rose 0.3 percent and 0.4 percent month-over-month. Economists were looking for a rise of 0.2 percent and 0.3 percent, in that order. Similarly, year-over-year, they expected headline inflation to increase 2.9 percent and core inflation 3.7 percent. The two metrics instead showed growth of 3.1 percent and 3.9 (3.86) percent.
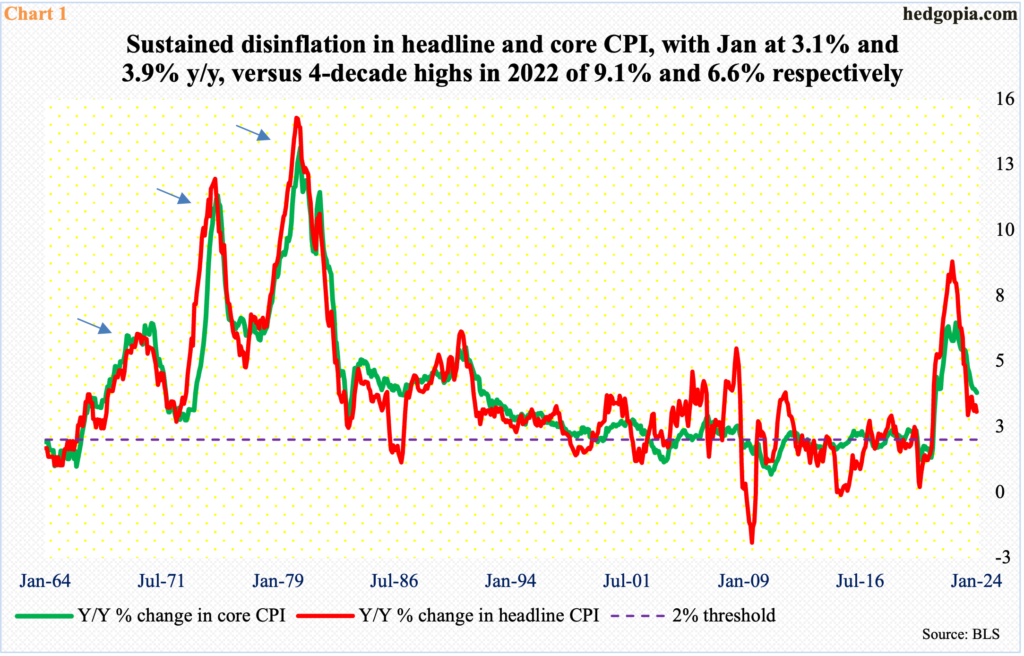
Yes, the annual inflation came in worse than the consensus, but it was lower than the pace seen in December, when headline and core CPI respectively rose 3.4 percent and 3.9 (3.93) percent. So, in essence, there is no change in the prevailing disinflation trend. Inflation has trended lower from 2022 when it was rising at four-decade highs, with the headline peaking at 9.1 percent in June that year and the core at 6.6 percent in September (Chart 1).
As soon as these numbers were published at 8:30 in the morning, equities immediately nose-dived. The weakness persisted throughout the regular session, although they finished way off the session lows. At one point, the S&P 500 was down to 4920 but recovered to end the session down 1.4 percent to 4953.
It seems stocks are looking for a reason to sell off. Tuesday’s CPI report was probably used as such, although it is hard to argue markets are anticipating the kind of resurgence witnessed in the 1970s (arrows in Chart 1).
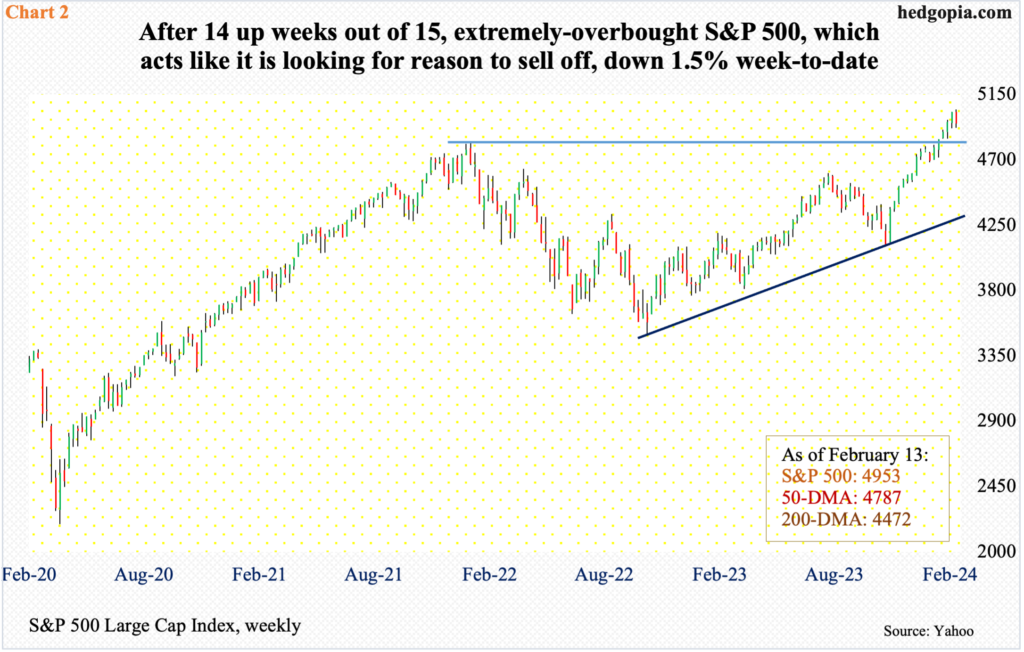
Equities are extremely overbought, having rallied uninterrupted for weeks. Going into this week, the S&P 500 was up in 14 of the last 15 weeks, having also eclipsed the January 2022 peak on January 19th (Chart 2). Since that breakout, the large cap index went on to tick 5048 this Monday, when the index reversed with a shooting star. This was followed by Tuesday’s gap-down, with bids showing up in the last 40 minutes just above the 20-day moving average. There is also short-term horizontal support at 4910s.
If unwinding of the overbought condition the S&P 500 finds itself in has begun, there is a long way to go on the downside. The weekly particularly has a long way to go before it is done unwinding. Breakout retest at 4810s will be extremely important, with the 50-day just below at 4787.
Thanks for reading!
