
- November job openings in U.S. non-farm payroll at yet another high
- As of December, not much change in momentum in oil and extraction jobs
- Job openings in mining and logging peaked in July and is sideways/down since
Job openings enable us to take a peek into what lies around the corner in the job market. Not what exists presently, but what the hiring picture will be like in the future. The Bureau of Labor Statistics’ JOLTS (Job Openings and Labor Turnover Survey) only goes back to 2004, but it has proven to be a useful series. Since its inception, ‘job openings’ led non-farm payroll by some six months in both the 2008 peak and the 2009/2010 trough (Chart 1).
As can be seen, they track each other very well. November was a new high for both job openings and non-farm payroll. (We only have JOLTS data for November. They are one month behind.) So nothing wrong with the national picture. But this is here and now. If there is one sector that has the potential to disrupt this stability, it is energy. The collapse in the price of crude oil is bound to reverberate through energy earnings/employment/capital expenditures.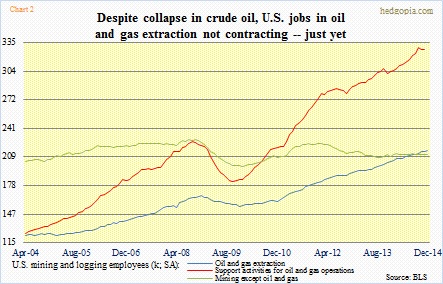
The BLS’ monthly Current Employment Statistics breaks what it calls “supersectors” into various industries. Mining and logging, for instance, is broken into oil and gas extraction, coal mining, metal ore mining, stone mining and quarrying, construction sand and gravel mining, support activities, and others. This helps us get a detailed picture into how things are separately. In oil and gas extraction, Chart 2 essentially shows that nothing has changed. Support jobs have gone sideways the past couple of months. The blue line (oil and gas extraction), however, continues its momentum. Contrast this with the green line (mining except oil and gas), which has gone sideways for over a decade now.
Because oil and gas extraction over the years has played such an important role in job creation, this is also the place to look for clues in regard to potential momentum reversal.
JOLTS does not break down industry data. It only has data for mining and logging, but not for oil and gas extraction.
With that, here is what is going on in the mining and logging industry in terms of job openings, etc.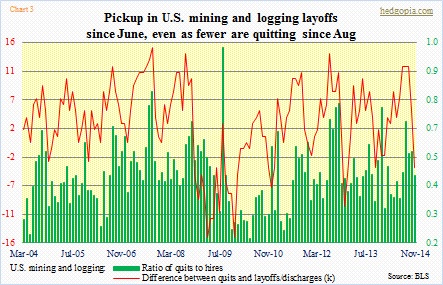
In Chart 3, the ratio of quits to hires has been weakening since August. Back then, 22k workers quit, versus 12k in November. Similarly, layoffs/discharges have picked up – from 8k in June to 16k in November. Fewer quits and more layoffs is not a good combo. From workers’ perspective, this could mean (1) there are fewer opportunities available, and (2) what is transpiring in the oil complex is beginning to affect their confidence to quit.
Chart 4 throws more light on this. The green bars represent non-farm job openings nationally, and they are at a new high. The red line is openings in mining and logging. There is a potential problem. Openings peaked in July at 36k, came down and rose again to match that high in October, only to fall back down to 25k in November.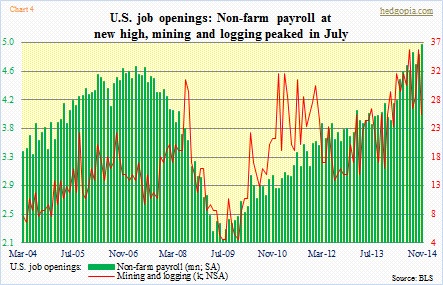
If there is any consolation in Chart 4, it is that there is no perfect correlation between the two variables, and that the red line is jagged, more volatile. So it is entirely possible that the recent trend in job openings (mining and logging) is just a noise and that the trend reasserts itself in due course. Possible, but with very low probability. Given what is going on in the oil patch, the odds of this being the beginning of a trend are very high. Could end up being a canary in the oil mine.
