
Traders – the good ones – must be having a field day. Stocks are swinging wildly.
IWM, the iShares Russell 2000 ETF, fell 11 percent during August 17-24, then rallied nearly 10 percent by September 17, fell again – nearly 10 percent – by September 29, before rallying eight-plus percent (Chart 1). All this in seven weeks!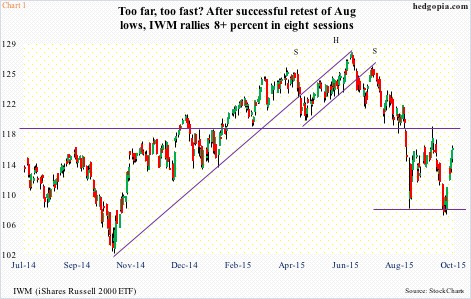
Moves of this magnitude are not normal. It just seems like traders are nervous holding near highs, but at the same time are driven by fear of missing out at lows.
But this also creates opportunities for nimble investors/traders. Anyone who even caught one of these swings – either direction – is sitting pretty.
Even after the most recent eight-day rally, the ETF is still down 2.3 percent for the year, and down just under 10 percent from the June 24th all-time high of $128.19.
Realistically, it is next to impossible to be catching each swing with precision. Be that as it may, options can enhance the odds of at least taking part directionally – by selling upside calls and downside puts, among other strategies.
Just seven sessions ago, it looked like an opportune time to be selling puts, and turns out it was. The $1.26 premium earned from hypothetically selling weekly October 9th 108 puts was kept. Now, it looks like the time is ripe for a trade betting on the other direction.
Last week, IWM ($115.74) jumped 4.6 percent. And, as stated previously, from September 29th low to Oct 9th high, it has rallied eight-plus percent. On Friday, bulls and bears played it to a draw. The session produced a doji – just above its 50-day moving average ($115.31).
The best-case scenario for the bulls this week is that it continues to rally toward the upper Bollinger band ($118.62). Incidentally, that is an area of massive resistance going back to March last year (Chart 1). That support was taken out during the August sell-off, followed by an unsuccessful backtest on September 17, when stocks reversed post-FOMC decision not to raise rates.
To be clear, there has been improvement in IWM’s price action in recent sessions. As a matter of fact, it was the only one of the major U.S. indices to have undercut August 24th lows. Even as the price was making a lower low on a daily chart, several indicators such as the CCI, RSI and MACD were making higher lows – a positive divergence. With that said, it is possible it has rallied too fast, too soon.
The options market is beginning to price this in.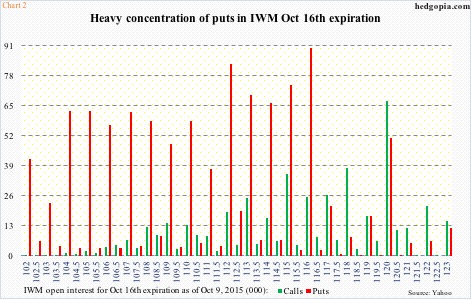
If we focus on open interest for the October 16th expiration, puts heavily outweigh calls. Sure some call strikes have sizable open interest, for instance the 120, which has 67,000 contracts. But this is more than four points out of the money, with premium of four cents. A shot in the dark! At/near-the-money call strikes stand no comparison. On the put side, 115 has 74,000 contracts, and 116 nearly 90,000 (Chart 2).
Over in the futures market, there is a similar message. As of Tuesday last week, non-commercials raised net shorts in Russell 2000 mini-index futures to a seven-week high (Chart 3). By that session, the ETF was up 1.7 percent for the week, and these traders used that as an opportunity to add to net shorts. IWM rallied another 2.9 percent in the next three sessions, so the trade has not worked so far.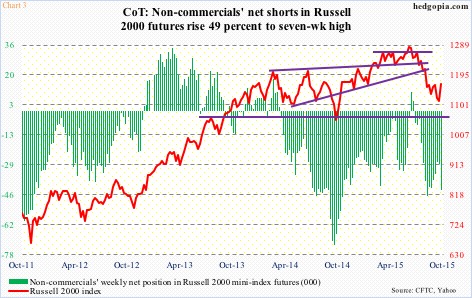
Here is the thing. If buyers show up in good numbers this week and defend the 50-DMA, pushing the ETF higher, that afore-mentioned resistance is a good place to be thinking about building shorts. Options can help.
Hypothetically, October 16th 117 calls sell for $0.47. If IWM rallies 1.1 percent this week (you never know, since we are in the midst of earnings season), it is an effective short at $117.47, right underneath that resistance. Else, the premium is kept.
Thanks for reading!
