
The July 2nd ITB 27.50 naked calls hypothetically written on June 24 ended up in the money by six cents. The ETF closed at $27.56 last Thursday. Calls were sold for $0.38, so, after assignment, it is now an effective short at $27.88.
The question now is, stay short, cover for a small profit or stay with it with options built in?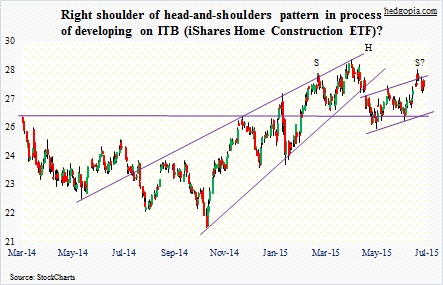
First of all, ITB of late has struggled to cash in on good housing data.
May sales for both new and existing homes were decent – up 2.2 percent month-over-month (to a seasonally adjusted annual rate of 546,000 units) and up 5.1 percent m/m (to a seasonally adjusted annual rate of 5.35 million units), respectively. Sales of new homes were revised higher for the prior three months. Since then, the ETF has only managed to trade flat.
The day of the naked call write, ITB rallied to $28.33 intra-day, could not hold on to the gains, and has come under pressure since. Here is the thing. As the chart above shows, that high can potentially act as the right shoulder of a head-and-shoulders pattern. In a textbook head and shoulders formation, the right shoulder should be slightly below the left shoulder – which is not the case here. Also, volume ideally should be increasing as the pattern moves from left to right – again, not so now. Nonetheless, it is something to watch. The pattern completes if the neckline – around $26.50ish – breaks. Support at $26-$26.50 goes back a couple of years.
Bulls have defended that support over and over – the most recent being a month ago. In recent months, short interest has played a role in this.
Short interest increased 16 percent period-over-period to 15.1 million by mid-June. This year, there have been two other occasions in which short interest rose to 15 million before dropping. Early in the year, it declined from 15 million at the end of January to 11.4 million two months later, and the ETF jumped from $25.30 to $28.21. Then it dropped to 13 million end-May from 15.2 million at the end of April; the ETF rose from $25.90 to $26.60, but not before rallying to $27.62 in between.
This time around, the ETF closed at $26.92 mid-June, when short interest stood at 15.1 million. It then rallied all the way to previously-mentioned $28.33 by the 24th, before backing off. So it is possible shorts already got squeezed. It is equally possible they added to shorts after witnessing the ETF was unable to rally on ostensibly good news. We will find out when end-June numbers are reported this Friday.
So in the near-term, the ETF could go either way, especially considering what is happening in Greece.
Weekly July 10th 27.50 puts fetch $0.28. A short put either raises the effective price it was shorted at to $28.16 or effectively covers it for a profit of $0.66. Both scenarios are fine in their own right, with the former with an eye toward the medium-term and the latter toward the near-term.
Thanks for reading!
