Most traders on Wall Street grew up in a low-interest-rate, low-inflation environment. It is hard for them to relate to why Volcker acted the way he did in the late-‘70s/early-‘80s. Greenspan, Bernanke and Yellen operated at a time when inflation was either falling or very low. This allowed them to only focus on jobs. Powell’s current focus is on inflation – the way Volcker’s was. The disconnect between Powell and markets has the potential to hurt the latter next year.
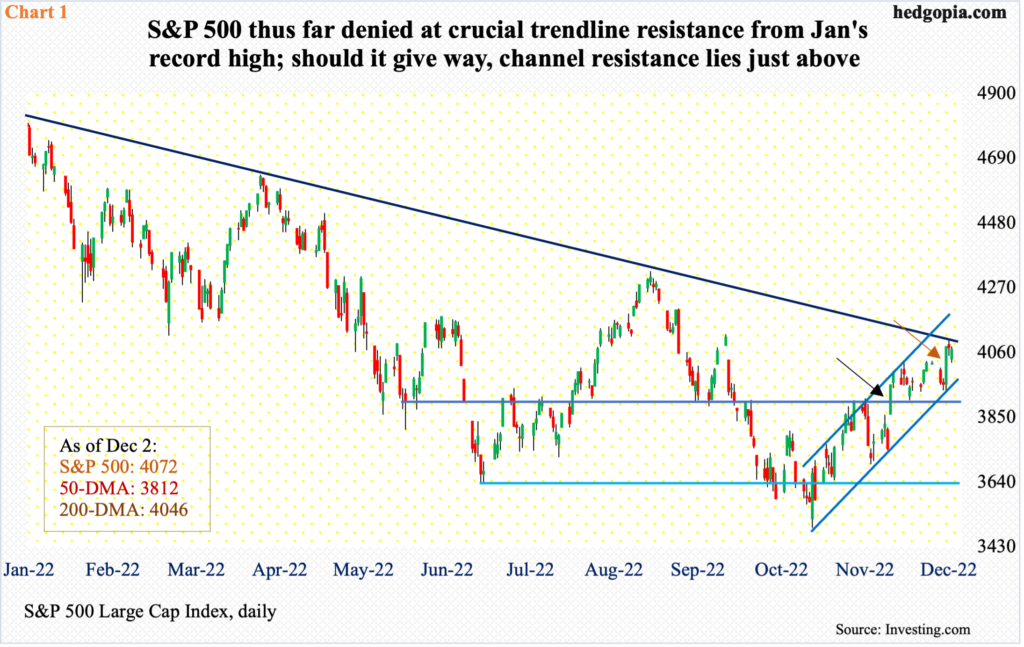
Last Wednesday, Federal Reserve Chair Jerome Powell’s comments ignited a huge rally in both equities and bonds. The S&P 500 jumped 3.1 percent in that session (brown arrow in Chart 1). Bulls latched on to Powell’s statement saying “the time for moderating the pace of rate increases may come as soon as the December meeting.” This was interpreted as dovish, but the fact is that he simply repeated what he has been saying for several weeks now – that inflation remains too high and that monetary policy will remain restrictive until real progress is made on that front.
The bulls, on the other hand, are yearning for a pivot – for the Fed to not only stop hiking but go the other way. On November 10, the day October’s consumer price index was reported and came in lower than expected, they rallied the S&P 500 5.5 percent (black arrow) and are constantly looking for data to suit their bias.
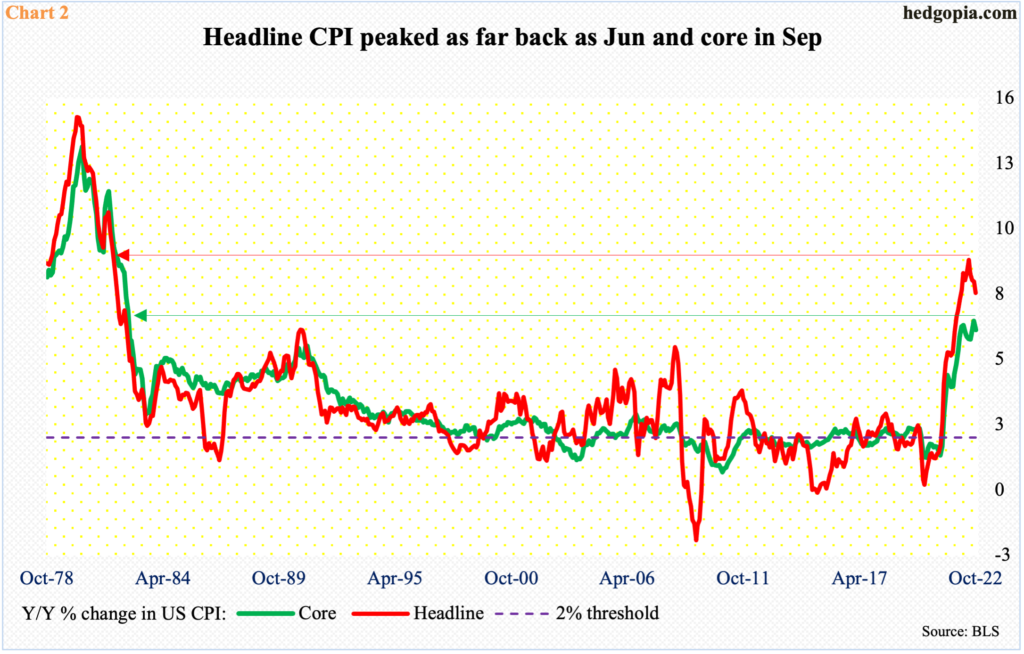
October’s CPI report was one such data point. Headline and core CPI in that month increased 7.7 percent and 6.3 percent year-over-year. This was the fourth month in a row in which y/y headline inflation fell month-over-month, having reached the cycle high 9.3 percent in June, which was the steepest since November 1981.
Core, on the other hand, grew 6.6 percent in September, before softening in October; September’s pace was the highest since August 1982 (Chart 2).
Inflation has gone parabolic since 2020 lows. Headline bottomed at 1.2 percent in June that year and core at 0.12 percent in May.
Part – or arguably a good portion – of the blame rests on the Fed. After Covid-19 began ravaging the economy in the early months of 2020, the central bank went into hyper mode of liquidity creation, using both conventional and unconventional methods.
The fed funds rate in no time was lowered to a range of zero to 25 basis points – essentially free money. Concurrently, the Fed aggressively began buying mortgage-backed securities and treasury notes/bonds.
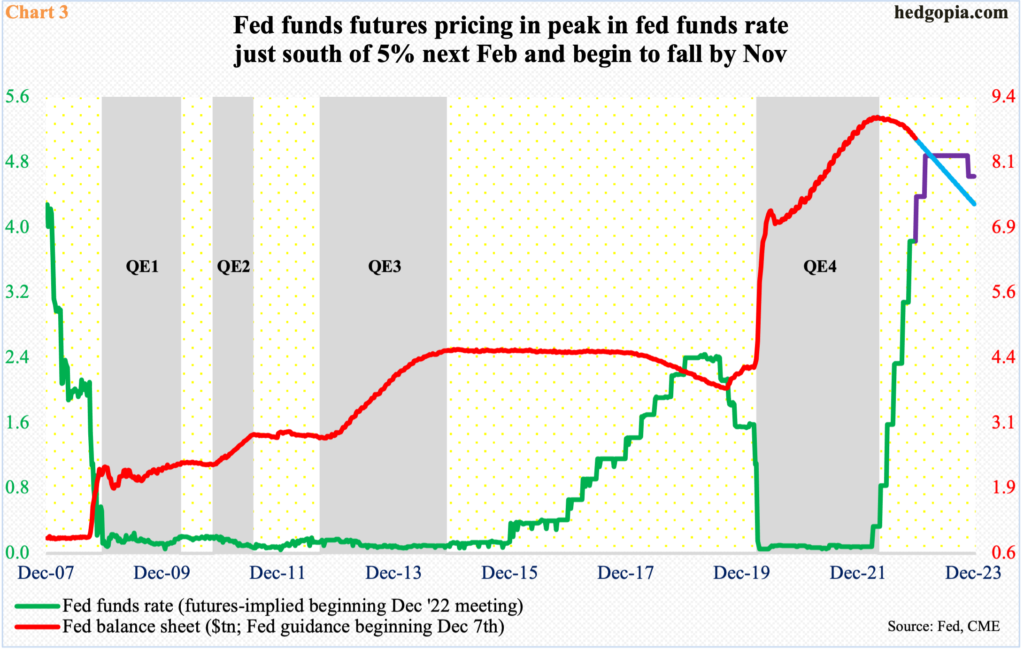
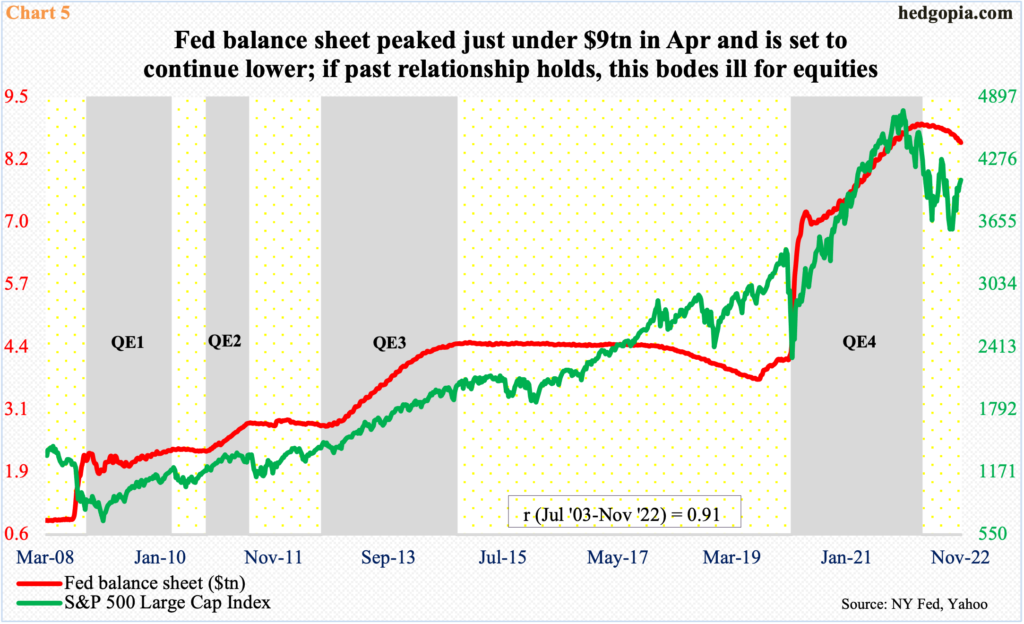
In early March 2020, it held $4.24 trillion in assets; by the time the balance sheet peaked in April this year, it had ballooned to $8.97 trillion (Chart 3). The government chipped in with its own fiscal stimulus. Both these measures lined up consumers’ pockets, helping create artificial demand for goods and services. Producers were simply not ready for the new demand. At the same time, they were facing supply constraints due to Covid-related lockdowns, etc.
The seeds of inflation were sown.
Powell at the time was essentially towing the line of his predecessors. Since the days of Alan Greenspan (August 1987-January 2006) – to be followed by Ben Bernanke (February 2006-January 2014) and Janet Ellen (February 2014-February 2018) – the so-called Fed put has been popularly used. Anytime markets threw a tantrum, the Fed caved in – for fear of the wealth effect’s negative impact on the economy. Markets have been spoiled – plain and simple. Initially, post-Covid, this is what drove Powell (February 2018-present) into action, as stocks took a nosedive.
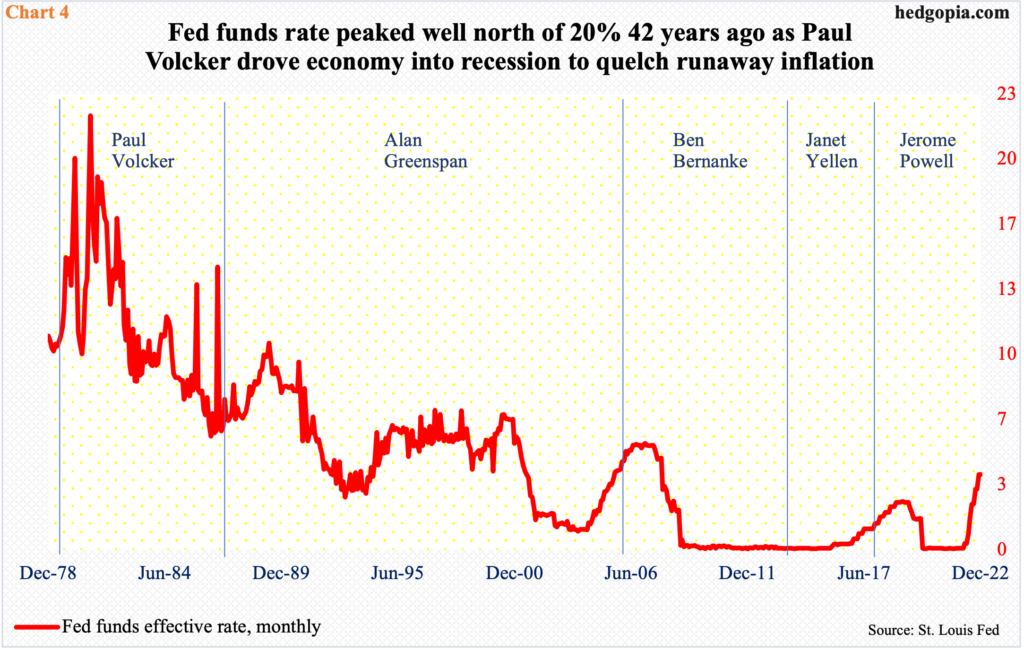
A good majority of the traders on Wall Street today grew up with this phenomenon etched in their brain. Most grew up in a low – ultra-low at times – interest rate environment. The new generation has no experience in, or exposure to, double-digit interest rates, as was the case in December 1980 when the fed funds rate peaked at 22 percent (Chart 4). The Paul Volcker (August 1979-August 1987)-led Fed had the required fortitude at the time to raise the benchmark rates high enough end-demand was smothered, leading to recession. It was only then that inflation was brought under control. Headline CPI peaked at 14.8 percent in March 1980 (Chart 2).
Powell could very well need to pull a Volcker in the months/quarters ahead. He will, if the need be. He has dropped enough hints already. Markets, on the other hand, are still living in the Greenspan-Bernanke-Yellen days – the days of Fed put.
The Fed operates under a dual mandate of maximum employment and price stability. Greenspan, Bernanke and Yellen all three led the Fed when inflation was either falling or was very low. This allowed them to only focus on the jobs mandate. This is precisely what Powell did post-Covid.
Now, the sole focus in on inflation. This could complicate things for equity bulls who are operating under the expectation that the terminal rate is less than five percent and that the Fed would start cutting by next November (Chart 3). This is a Fed-put mentality, which could be setting themselves up for disappointment next year – particularly considering that the Fed’s balance sheet has peaked.
Going back to July 2003, the correlation coefficient between Fed assets and the S&P 500 is a tight 0.91 (Chart 5). The large cap index tends to follow closely whether the Fed is adding or cutting assets. As things stand, this factor is a headwind.
Currently, the S&P 500 is just under a falling trendline from January’s record high. Sellers showed up at this resistance last week. In the event the bulls are able to reclaim the trendline, just above lies ascending-channel resistance (Chart 1).
Thanks for reading!

