
With 2Q23 earnings season nearly over, S&P 500 companies are set to earn more than what was expected at the start of the quarter. This, however, is not so as relates to S&P 400 and 600 companies. Mid- and small-caps have larger exposure to the domestic economy, so this in and of itself does not bode well for next year’s earnings optimism.
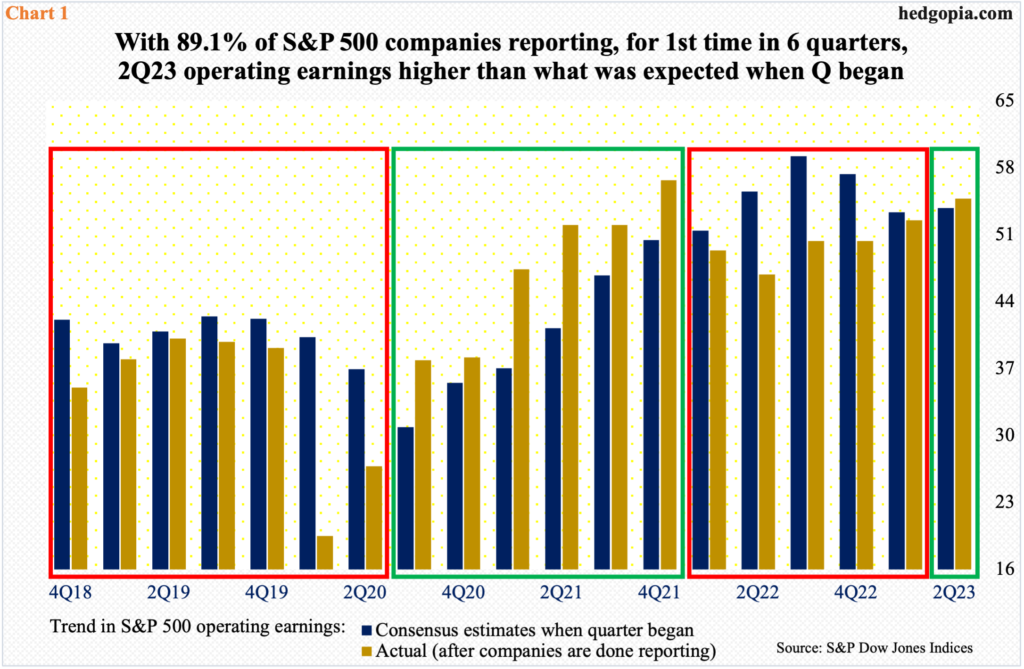
As of last Tuesday, 89.1 percent of S&P 500 companies have reported their June quarter, ringing up $54.80 in blended operating earnings. When the quarter began, the sell-side had penciled in $53.78. If this holds by the end of the season, this would be the first time in six quarters that earnings would have come in higher than what was expected at the start of the quarter.
Before this, for five quarters through 1Q23, these companies were unable to meet the estimates prevailing at the start of the quarter. Before that, for six quarters from 3Q20 to 4Q21, they exceeded those expectations – as is the case with 2Q23 thus far.
At least going back the last several years, once there is a change in trend, it persists for several quarters (highlighted in Chart 1 using red and green boxes). Equity bulls, therefore, hope this is the beginning of a trend. Often, rally odds tend to favor them if blended estimates get revised higher as the reporting season progresses.
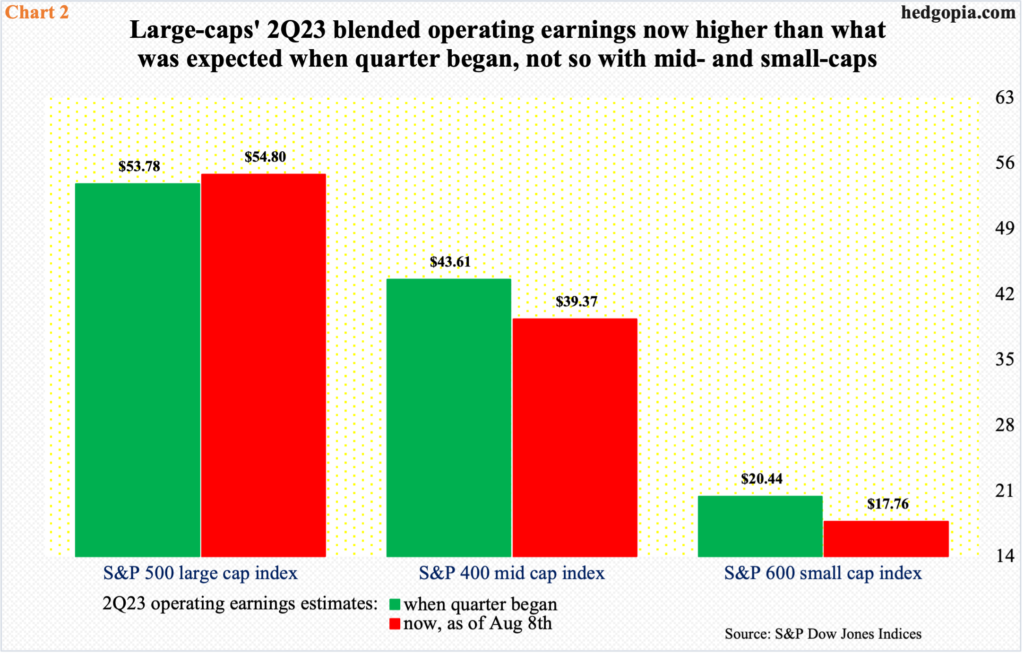
Interestingly, in the June quarter so far, only the large-caps are witnessing this phenomenon; mid- and small-caps are not.
At the start of 2Q, S&P 400 mid cap companies were expected to earn $43.61; until last Tuesday, they had rung up $39.37. Similarly, S&P 600 small cap companies were expected to earn $20.44 when the June quarter began and had earned $17.76 as of last Tuesday (Chart 2).
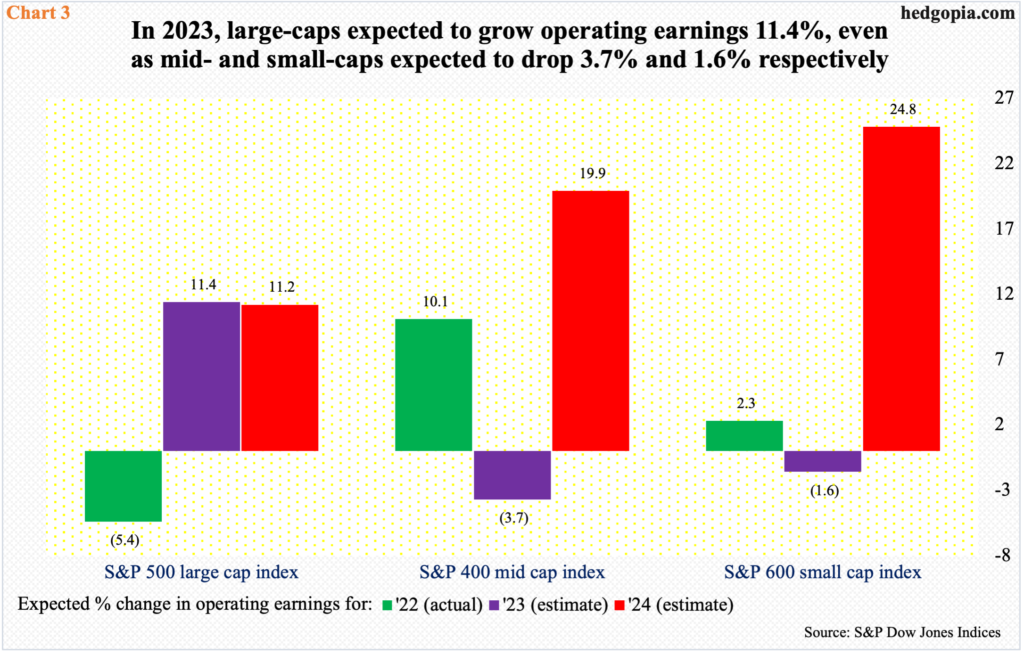
Mid- and small-caps are also diverging with large-caps for all of 2023. The year is only about halfway through, and the sell-side has S&P 500 companies growing operating earnings 11.4 percent this year. In contrast, S&P 400 and 600 earnings are expected to decline this year by 3.7 percent and 1.6 percent, in that order (Chart 3).
It is possible 2023 is turning out to be an offset for last year; 2022 S&P 500 earnings were down 5.4 percent to $196.95, while S&P 400 and 600 companies grew theirs by 10.1 percent and 2.3 percent to $169.35 and $75.96 respectively. This year, S&P 500/400/600 earnings are expected to come in at $219.41, $163.12 and $74.73.
Or, there is something not quite right about the economy. When times are good, mid- and small-caps, who have a large domestic exposure, cannot be losing money. This particularly holds true for the small-caps.
In fact, small-caps are treated as a reliable measure to take the pulse of the economy. Using this as a yardstick, the message is not very encouraging.
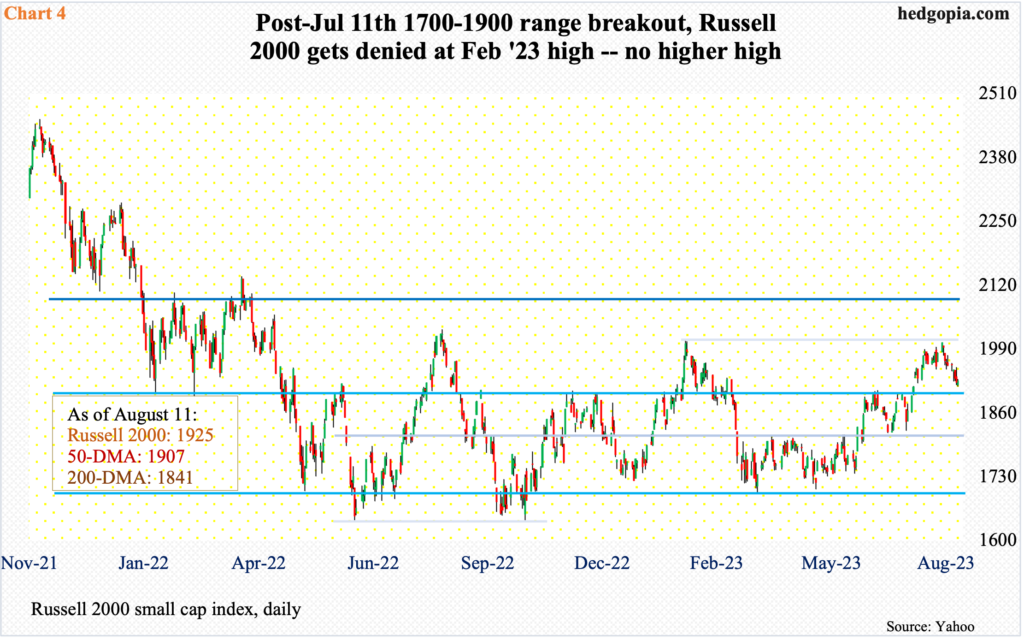
The Russell 2000 went sideways between 1700 and 1900 from January last year until a month ago when on July 11 it finally broke out. This could have been an important breakout, having come off such a large base. But the momentum soon petered out.
Post-1900 breakout, the small cap index did rally to 2004, which was hit on July 31, but this fell short of eclipsing the February high of 2007 (Chart 4). No higher high – not this time anyway – raising the odds of the index revisiting the breakout point sooner than later. Having closed last week at 1925, with a low of 1914 on Friday, the index in all probability will slide back into the range sooner than later.
Last month’s breakout is more technical in nature and likely did not occur anticipating a big improvement in fundamentals.
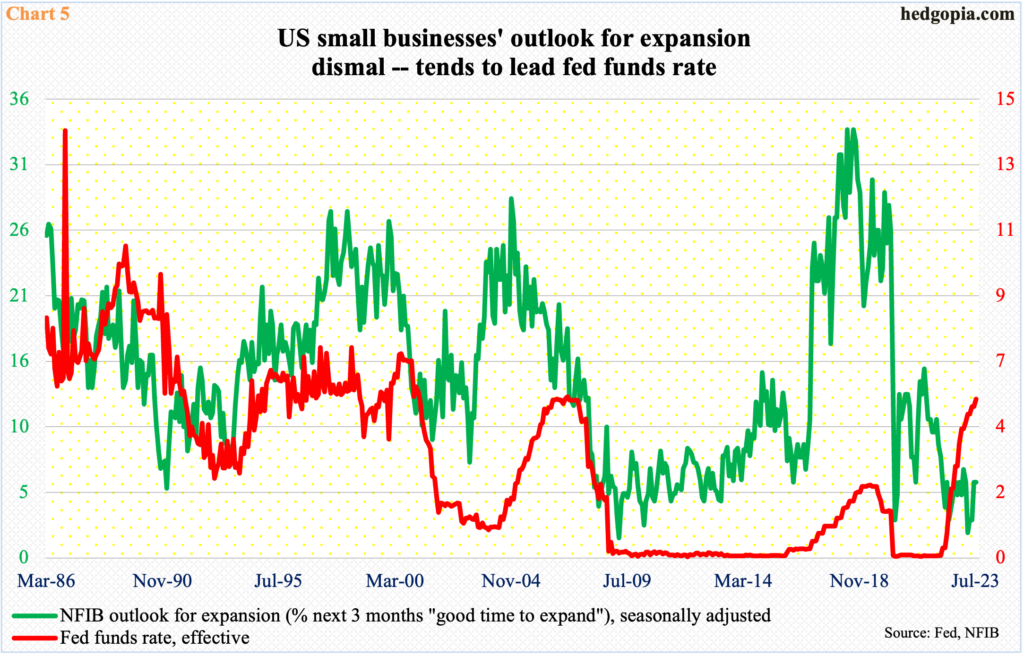
Speaking of fundamentals, small-business sentiment – represented by National Federation of Independent Business members – continues to get stuck in the rut. The NFIB outlook for expansion is quite suppressed. July was unchanged month-over-month at six. March’s reading of two matched the March 2009 all-time low. Back then, the S&P 500 bottomed in that month and this was also three months before the then recession ended. Equity bulls – or macro optimists – hope things turn out similarly this time around.
However, Chart 5 shows that the ‘NFIB outlook for expansion’ metric tends to lead the Federal Reserve’s interest-rate action. The prevailing tightening cycle, however, was not flagged by it, as the green line went sideways at best. If the relationship between the two reestablishes itself, then small-business sentiment is set to worsen once the Fed begins to ease.
If fed funds futures traders are right, that day is not too far off into the future.
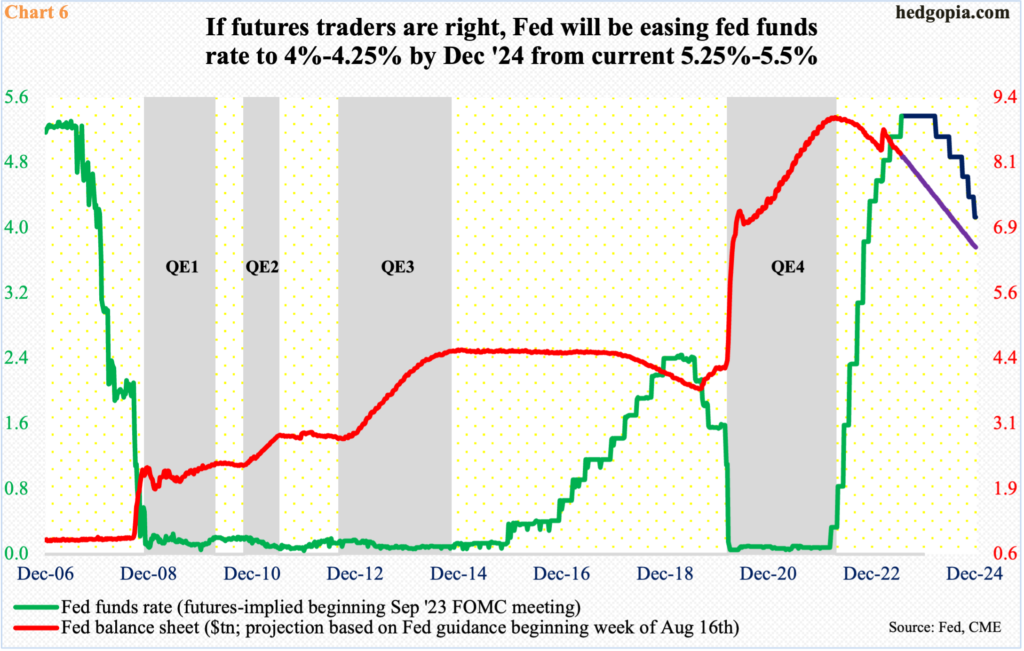
The fed funds rate was raised by 25 basis points in last month’s meeting, to a range of 525 basis points to 550 basis points. Fourteen months ago in March last year, these rates were zero to 25 basis points – left there languishing for two whole years post-Covid economic disruptions.
Both the FOMC statement and Chair Jerome Powell in the presser made it clear last month that September would be a live meeting, suggesting a pause is as much possible as a hike. Fed funds futures traders continue not to expect another hike. To them, July’s was the last hike in the tightening cycle and that the benchmark rates would be aggressively cut next year, with the first easing coming in March or May and ending 2024 between 400 basis points and 425 basis points (Chart 6). The Fed, which is also actively reducing its balance sheet, has persistently pooh-poohed this outlook.
When it is all said and done, the Fed and futures traders will probably meet in the middle next year. These traders are probably too pessimistic and the Fed too optimistic. Odds favor the Fed begins to ease next year. In this scenario, the growth optimism built into earnings – S&P 500 (11.2 percent), S&P 400 (19.9 percent) and S&P 600 (24.8 percent) – risks huge disappointment.
Thanks for reading!
