
The sell-side customarily has lowered estimates going into the 2Q earnings season. Stocks have rallied since early June, thanks also to an impending rate cut by the Fed later this month and resumption of trade talks between the US and China. A lot of optimism has been priced in, reflected in options and volatility, which are getting closer to getting extended.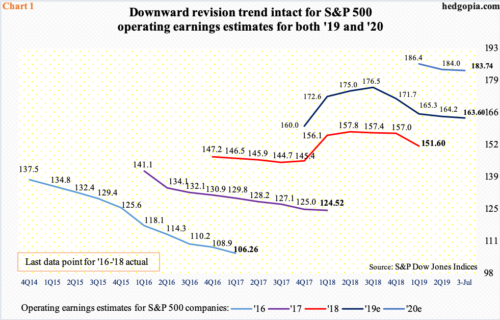
The 2Q earnings season begins in earnest this week. It is customary for the sell-side to gradually cut estimates into reporting. This season is no exception. When the quarter began in April, 2Q19 S&P 500 operating earnings estimates were $40.88. They are now $39.44. Last August, estimates were as high as $43.84. From this standpoint, the bar is low.
The downward revision trend is also evident in the remaining two quarters this year, with 3Q having gone from $45.11 last November to $42.40 and 4Q from $47.14 to $43.76. As things stand, 2H is expected to bring in 52.7 percent of this year’s blended estimates of $163.60, which peaked last August at $177.13 (Chart 1). Considering that the uncertainty over US-China trade disputes has not been lifted, companies are unlikely to provide optimistic forecasts. The downward revision trend likely continues for this year, not to mention pie-in-the-sky 2020 estimates.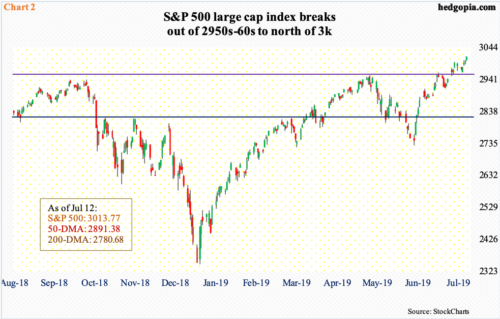
In general, US stocks have rallied big into earnings.
The S&P 500 large cap index (3013.77) had a rough May but rallied 10-plus percent in June and July-to-date. Last Friday, it closed over 3000 for the first time ever, for a new intraday high of 3013.92. The daily in particular is grossly extended, but bulls carry the momentum, with both 10- and 20-day moving averages rising. Near term, there is decent support near prior highs of 2950s-60s (Chart 2).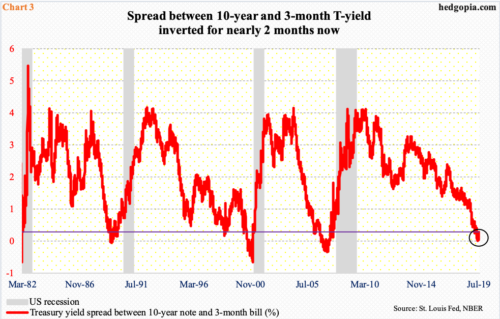
Besides the upcoming earnings season, there were two other major factors providing tailwind to stocks. One was the US-China G20 meeting late June between Presidents Donald Trump and Xi Jinping and the other the Fed’s interest rate outlook.
Trade talks between the US and China have resumed, although markets may be too quick to price in a successful resolution, but momentum-driven bulls are not too worried about that right now. Besides, Jerome Powell, Fed chair, has offered them exactly what they needed to carry the momentum further.
For a while now, fed futures have priced in at least a couple of 25-basis-point cuts in the fed funds rate this year. The Fed is not quite at that level yet but is increasingly turning dovish. In last week’s semi-annual Humphrey-Hawkins testimony, Mr. Powell all but said a cut is coming later this month. Ahead of his Congressional appearance, after a much-better-than-expected June jobs report, there was speculation that maybe he would signal he would want to wait for more clarity. He did not.
Mr. Powell, along with several other FOMC members, are likely also focused on what the Treasury yield curve is signaling. The yield spread between 10-year notes and three-month bills remains inverted for nearly two months now (Chart 3). More often than not, this tends to portend economic contraction/weakness. The Fed would like to drive the spread into positive territory.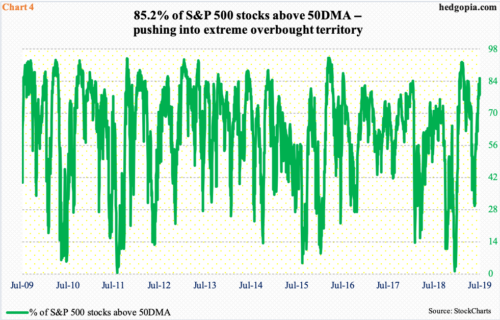
As mentioned above, the S&P 500, and several other major indices, have been pushed into overbought territory. Chart 4 presents the percent of S&P 500 stocks above their 50-day. Last Friday, the metric stood at 85.2 percent. On May 31, this had dropped to 29.6 percent, which led the foundation for the rally in the S&P 500 in June and July. With this, the green line is pushing into high 80s-low 90s where it increasingly gets hard to sustain the momentum. In other words, things are getting extended.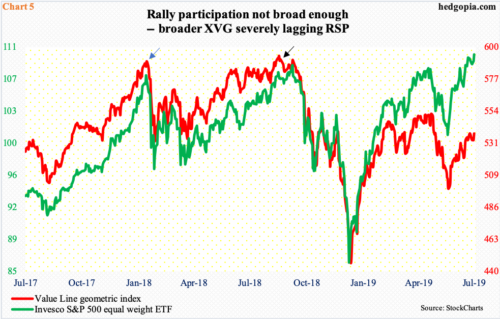
Then, there is the issue of a lack of broad participation.
Crucial sectors such as transports and small-caps are acutely lagging. Large-caps are doing most of the heavy-lifting. From the risk-on perspective, this is not so confidence-boosting, unless one has bet on the right horse.
In Chart 5, the Value Line geometric index, which is equally weighted, is plotted against the Invesco S&P 500 equal weight ETF. They peaked together in January last year and then again in August/September (blue and black arrows). This time around, they have diverged, with the S&P 500 equal weight ETF rallying to a new high last Friday, even as the Value Line geometric index, which encompasses a much larger universe of stocks, is nowhere near its all-time high from last August. In fact, the latter is toe-to-toe with the Russell 2000 small cap index, which, too, severely lags its large-cap peers.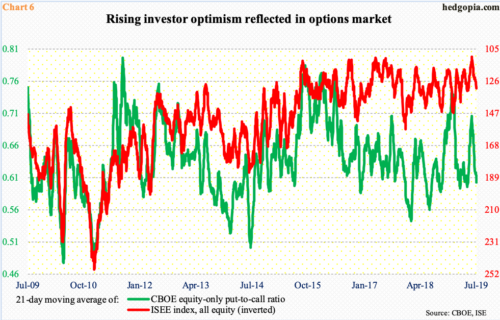
The lack of broad participation is a potential warning sign, particularly so when investor optimism is on the rise and getting extended.
The S&P 500, along with several other major equity indices, bottomed intraday on June 3. A couple of sessions later, on June 5, the 21-day moving average of the CBOE equity-only put-to-call ratio peaked at 0.706. The subsequent unwinding provided a tailwind to stocks. Last Friday, the ratio stood at 0.603. Unwinding can continue until the ratio drops to low-0.60s/high-0.50s, or even to mid-50s as was the case in January last year.
Viewed this way, there is a little bit more room for the ratio to drop, which in the right circumstances can support stocks near term.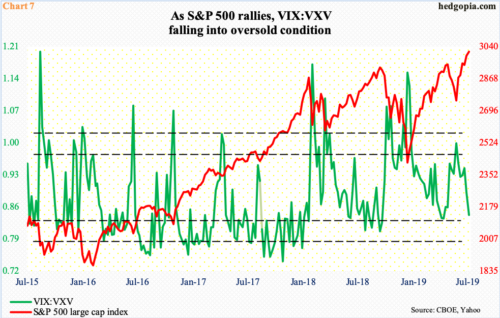
There is a similar message coming out of the ratio of VIX to VXV. VIX measures expectations for 30-day future volatility using S&P 500 options. VXV does the same but goes out to 90 days. As the S&P 500 rallies, premium comes out of VIX faster than longer-term VXV, putting the ratio under pressure.
In the week that began on May 28, VIX:VXV peaked at 0.994 (arrow in Chart 7). Last week, it closed at 0.837. In a perfect scenario for equity bulls, this can drop to high 0.70s-low 0.80s. Then, odds of unwinding increase. As that happens, shorter-term volatility such as VIX rises faster, and stocks come under pressure. Until then, it is bulls’ ball to lose.
Thanks for reading!
