
Stanley Fischer, Federal Reserve vice chair, last week stated that U.S. inflation should rebound next year. As things stand now, government data do not show much inflation.
In September, consumer prices, measured by the consumer price index, were unchanged in the 12 months through September. Core CPI, however, jumped 1.9 percent – the largest increase since July 2014. Core CPI is a hair’s breadth away from hitting the Fed’s inflation goal of two percent. But core PCE, the Fed’s favorite measure of inflation, only rose 1.3 percent in September.
Amidst this, if their model is forecasting a pickup in inflation come 2016, then they will need to act. Most FOMC members’ tone has increasingly gotten hawkish in recent weeks – as if a December move is all but certain.
It is probably sill too soon to say for sure if a hike is imminent in a month’s time, but if the Fed does indeed move, then it would have come at a time when inventory is sitting at a precarious level.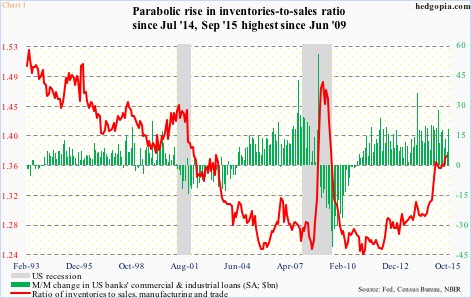
The ratio of inventories to sales in U.S. manufacturing and trade in September rose to 1.377 – the highest since June 2009. The rise in the red line in Chart 1 has gone parabolic particularly since July last year. During the period, inventories have risen 2.9 percent, to $1.82 trillion, even as sales have dropped 3.3 percent, to $1.32 trillion. This inventory accumulation has been accompanied by sustained increase in banks’ commercial & industrial loans – at $1.93 trillion in October.
If there is any consolation in all this, it is that the pace of month-over-month increase in C&I loans has decelerated. That said, what is already built will need to be consumed, and that takes away from growth in future months/quarters.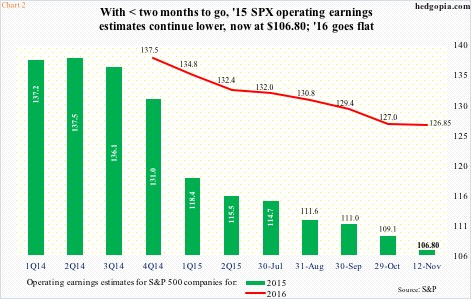
This will reverberate through corporate sales and earnings – as if it has not already. Next year, operating earnings of S&P 500 companies are expected to jump nearly 19 percent, to $126.85! If realized, that would be quite a reacceleration. This year, if estimates are met, earnings would have declined 5.5 percent over 2014, to $106.80 (Chart 2).
As sales have plateaued and earnings are in decline, multiples have expanded. The S&P 500 price-to-sales ratio reached 1.8 in 2Q15, higher than previous cycle peaks of 1.52 in 2Q07 and 1.77 in 4Q00 (1.69 in 3Q15). And the trailing 12-month P/E (operating) is north of 20.
With this as a background, equity bulls should be glad stocks are hanging in there.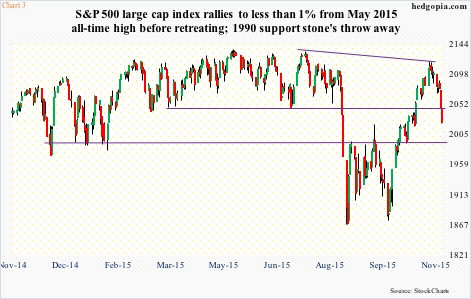
Even after last week’s drop, the S&P 500 index is only five-plus-percent off May’s all-time high (Chart 3). The Nasdaq 100 just notched an all-time high less than two weeks ago, and has since declined nearly five percent. And, the Dow Industrials is down six percent from its all-time high in May.
Large-caps are holding up better. The Russell 2000 small-cap index is down 11.5 percent from its all-time high in June.
But the bigger question is, where to from here? Does last week’s sell-off have the potential to develop into something big or are stocks merely unwinding overbought conditions?
As far as fundamentals go, it is unlikely things take a turn for the better anytime soon. Credit spreads have widened. Oil has broken down, and is on the verge of testing August lows. Zinc, copper, and lead are all down.
In a time like this, one should probably look toward technicals to get a better read.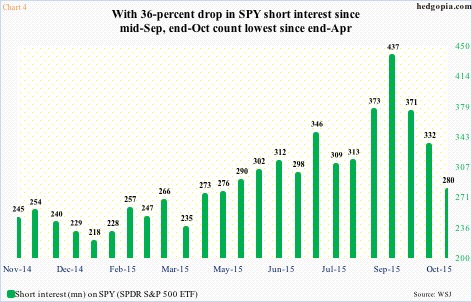
For instance, the September 29th low on the S&P 500 helped form a double bottom, later resulting in a W formation. The powerful technical signal probably caused many a short to give up, and cover. Short interest on SPY, the SPDR S&P 500 ETF, dropped 36 percent in the month and a half ended October 30th (Chart 4). Short interest helped, as did central-bank rhetoric.
Staying with the S&P 500, as things stand now, daily conditions will soon enter oversold territory. Ditto with the Nasdaq 100, and the Russell 2000.
Of the three, not surprisingly, the Russell 2000 acts the weakest. Having lagged its large-cap brethren since the September 29th low, the Russell 2000 was struggling to get over resistance at 1170, let alone test major resistance at 1210-1215 (Chart 5). It briefly broke out of 1170, but was not able to hang on to it. Already under the 200-day moving average, it also lost 50-DMA last Friday.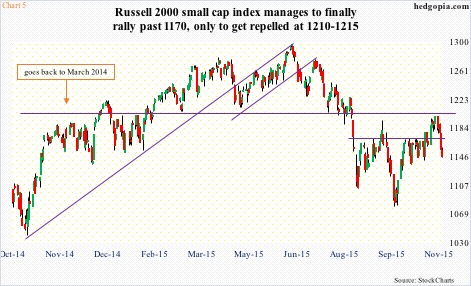
The Nasdaq 100, too, suffered some damage last week but nothing comparable to the Russell 2000. The euphoria over a new all-time high on the Nasdaq 100 did not last very long. As a matter of fact, the sell-off began in the very next week after notching that record. In the process, it has lost support at 4560 (Chart 6). The 200-DMA is a mere 1.6 percent away. That average likely gets tested.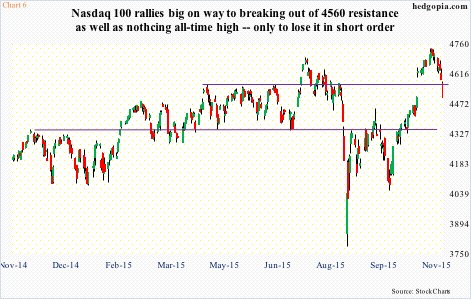
The S&P 500, on the other hand, has lost its 200-DMA, and is 0.8 percent away from its 50-DMA, which is still rising but could begin to go flat any time now. Bulls absolutely need to defend that average, or the 1990 level. A break of the latter support can mean bulls will have their work cut out for themselves.
On a weekly chart, momentum indicators are grossly overbought on the S&P 500. A break of the 1990 region potentially opens the door for hurried unwinding of those conditions. In this scenario, daily oversold conditions likely remain oversold for longer than is typically the case, and spot VIX continues higher. The latter has rallied above both its 50- and 200-day moving averages, and has momentum.
In the past, VIX momentum breaks once the spot spikes only to quickly retreat… this has proven to be a reliable signal.
Thanks for reading!
