
Homebuilder-focused ETF’s are at/near record highs. Momentum is intact, but builder sentiment – also at multi-year highs – is worth watching.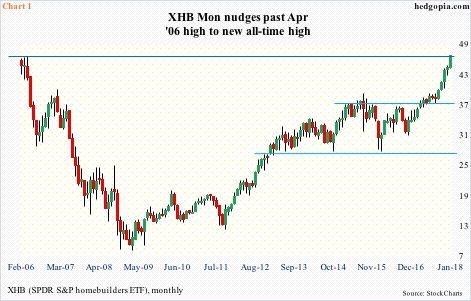
Homebuilding stocks are on fire.
XHB (SPDR S&P homebuilders ETF) is already up 5.6 percent for the year. Monday, it rose to a new all-time high of $46.82 – past the prior peak of $46.52 in April 2006 (Chart 1). After that peak, it dropped all the way to $8 in March 2009. It has been nearly a six bagger.
ITB (iShares U.S. home construction ETF), up 5.8 percent for the year, has done even better. It bottomed in March 2009 at $6.33 and closed Monday at $46.25 – a new closing high. Its all-time high was recorded in May 2006 at $50.10.
Both these ETF’s began life – XHB in February 2006 and ITB in May that year – as the housing bubble was bursting. So prices near/past prior highs probably suggest that excesses are once again building in housing.
That will depend on what housing metrics we focus on.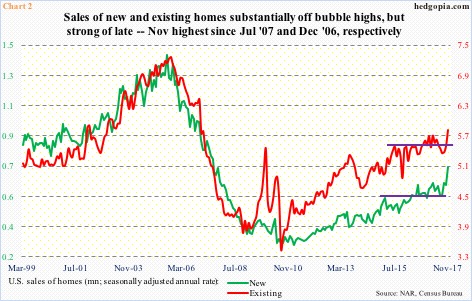
These ETF’s are definitely not responding to sales of homes. Sales have perked up, no doubt, but are nowhere near the peak levels.
In November last year, sales of new homes shot up 17.5 percent month-over-month to a seasonally adjusted annual rate of 733,000 units. In that same month, sales of existing homes rose 5.6 percent m/m to 5.81 million units (SAAR). This was the highest since July 2007 and December 2006, in that order.
During the bubble, new- and existing-home sales peaked at 1.39 million and 7.26 million in July and September 2005, respectively.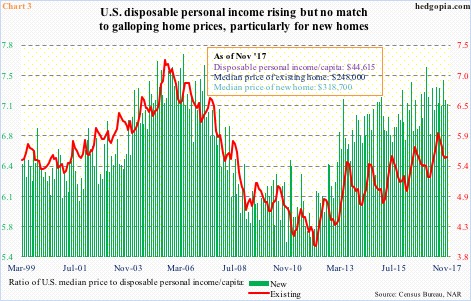
If there are excesses, they are definitely on the price front.
During the bubble days, the median price of a new home peaked at $262,600 in March 2007 and that of an existing home at $230,400 in July 2006. They were respectively eclipsed in June 2015 and February 2013, then rising to new highs of $328,500 (September 2017) and $263,300 (June 2017). November was respectively $318,700 and $248,000.
The persistent increase in home prices is particularly of note as income has failed to keep up.
Chart 3 uses the disposable personal income/capita to compute ratios versus both new and existing home prices. The red line (existing) has trended higher, but still substantially off the bubble high. The green bars (new), however, are not that far off, suggesting the price of a new home has risen much faster versus income.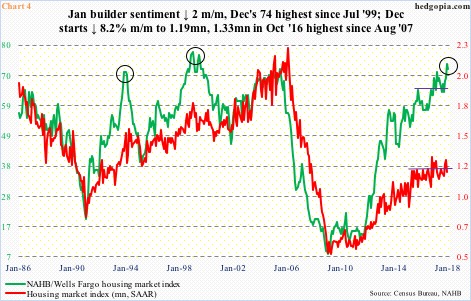
This is probably why builder sentiment is as elevated as it is. This month, sentiment dropped two points m/m, with December’s 74 highest since July 1999. The all-time high of 78 was reached in December 1998.
Despite this optimism, builders are not putting their money where their mouth is (Chart 4).
Housing starts in December fell 8.2 percent m/m to 1.19 million units. In January 2006, starts reached as high as 2.27 million units. This has helped suppress the supply of homes, putting upward pressure on the price.
Incidentally, the gap between sentiment and starts is widening. In the past, whenever this happens, sentiment sooner or later drops. And this can have repercussions for homebuilder stocks.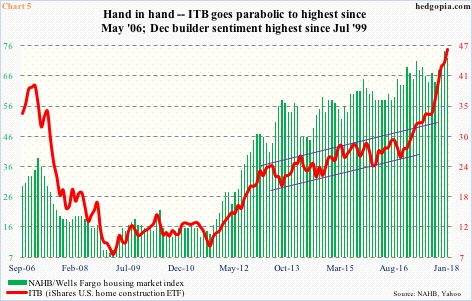
Chart 5 pits ITB against builder sentiment. There is a tight relationship between the two.
Since breaking out of $29 last February, ITB has gone parabolic – probably a good short candidate at some point. However, as overbought as it is on nearly all time frame (monthly RSI of nearly 86!), momentum is intact. The recent rise in interest rates has had no adverse impact.
That said, on the daily chart, the 10-day looks to be wanting to at least go flat. The bears likely get some traction once shorter-term averages roll over – not the case now. That will most likely be the case once builder sentiment begins to come under pressure.
Thanks for reading!
