
In the prior reporting period (Jan 15-29), short interest on XLE, the SPDR Energy ETF, collapsed just north of 17 percent to 40.7 million (Chart 1). During the period, the ETF dropped 8.1 percent through the January 20th intra-day low, before rallying. All in all, it ended up 7.1 percent for the period.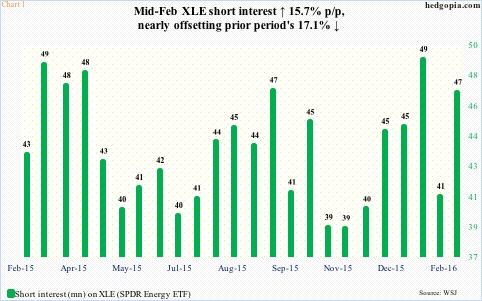
Apparently, XLE shorts decided not to press at/near those lows. They covered, and cashed in their profit. Either they were expecting XLE to stabilize and rally, or were waiting for better opportunities to go short again.
After it was repelled by $58.50 resistance on January 29th, XLE did indeed make a higher low on February 11th (arrow on Chart 2).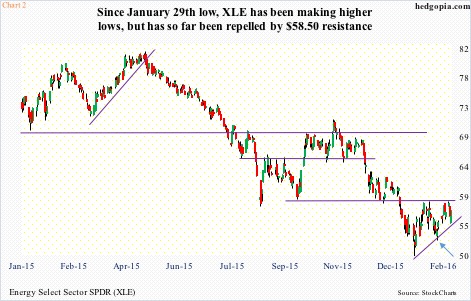
A similar phenomenon could be developing on SPY, the SPDR S&P 500 ETF.
In the latest period (Jan 29-Feb 12), SPY shed 3.7 percent. Short interest fell by 3.5 percent, to 283.5 million (Chart 3). Shorts apparently locked in profit. They probably had a reason not to press their shorts.
One day before the reporting period ended – on February 11th – SPY was in the process of retesting the January 20th low… that support went back to March 2014 (Chart 4). The February 11th low also came just outside the lower Bollinger Band. The odds of a successful retest were rising, giving an opportunity for nimble traders to even indulge in short puts.
Shorts’ instinct proved right. In the next five sessions since the reporting period ended, SPY rallied 4.5 percent.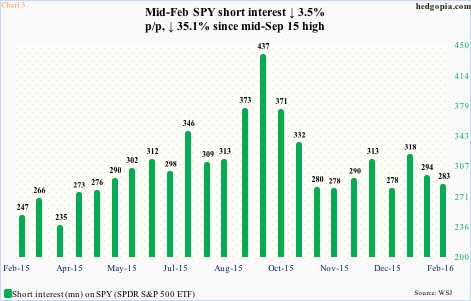
Now here is the thing.
What probably emboldened XLE shorts to increase net shorts by nearly 16 percent during the latest reporting period is the fact that the $58.50 level resisted – again – a rally attempt on February 4th (Chart 2).
In the current reporting period, that resistance has proven tough to crack in several subsequent sessions. As long as this holds, XLE shorts are fine. If there is a breakout, they likely get squeezed.
There is a similar phenomenon at work on SPY as well.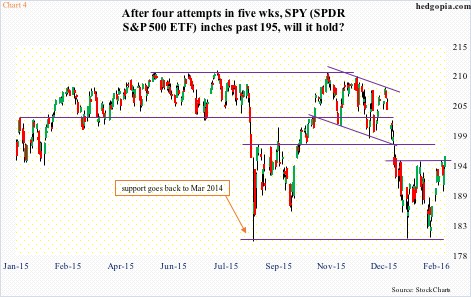
As stated earlier, they were right not to press shorts in the just concluded period. Since then, they once again saw $195 repel a rally attempt. This was on February 22nd; the first two rejections were on January 13th and February 1st (Chart 4).
The same way XLE shorts added to short interest after they saw resistance hold, if this rejection led SPY shorts to get aggressive, they probably have a decision to make. Come Thursday, the ETF rallied past both its 50-day moving average and that $195 resistance.
In the last five minutes yesterday, SPY rallied 0.14 percent, with substantial pickup in volume – nine percent of the daily volume. This smells like a squeeze.
Bulls must be hoping that after SPY was rejected at $195 on February 22nd, shorts added to short interest in the next couple of sessions. If that happened, there likely is more fuel for squeeze. Otherwise, end-February SPY short interest is relatively low (Chart 3).
How SPY ($195.54) trades today could be a good tell. If bulls succeed in building on yesterday’s mini breakout, new shorts likely would prefer to stay out of it for now.
Thanks for reading!
