
As of Monday this month, XLF (SPDR financial sector ETF) is down 6.3 percent. This followed a 6.6-percent rally in January. Since early September last year through last week’s high of $30.33, it jumped 27.5 percent.
Both the weekly and monthly charts are turning lower. In the right circumstances, more downward pressure is imminent.
Near term may be different. Monday – a session in which the ETF dropped five percent – bids showed up near two-month support at $27.60 (attached chart). This is as good a place as any for the bulls to step up and try to stem further bleeding.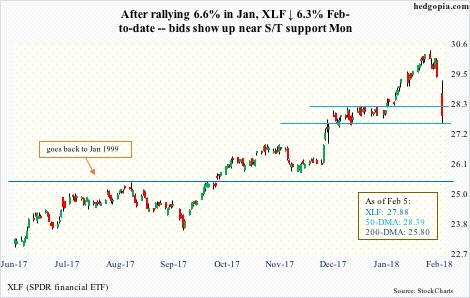
Right here and now, risk-reward odds favor short-covering. Shorts are likely to get active again at the broken 50-day moving average at $28.39.
Back on December 14, XLF was hypothetically shorted intraday at $27.84. This was followed by two short puts – one on December 19 and the other on January 8 – totaling $0.63, raising the short price to $28.47. XLF closed Monday at $27.88. Quite a recovery given this was an idea gone wrong right from the beginning – hence necessitating damage repair through the short puts.
Thanks for reading!
