
Tech has surprised everyone with its out-of-the-park performance this year. Even within tech, XLK outperforms QQQ, as the former posted a new high this week while the latter is still below its November 2021 high. It turns out XLK is dangerously over-reliant on MSFT and AAPL.
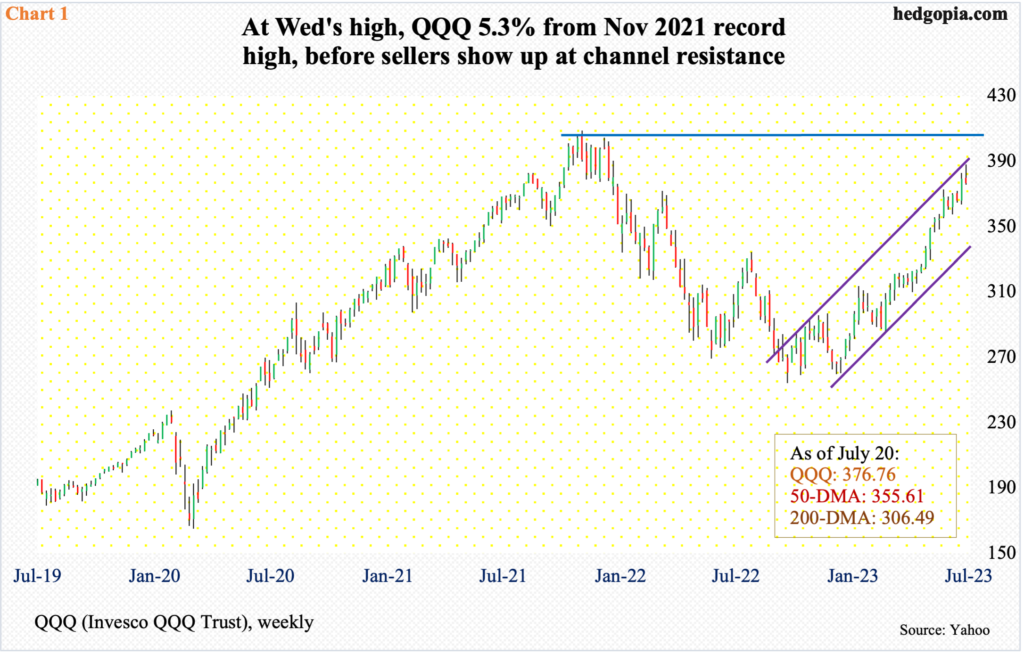
Tech clearly has been a go-to sector this year. Year-to-date, the Nasdaq composite is up 34.4 percent and the more-concentrated Nasdaq 100 41.4 percent. QQQ (Invesco QQQ Trust), which tracks the Nasdaq 100, is up 41.9 percent.
At Wednesday’s high (387.98), in fact, QQQ was up 46.1 percent for the year. With seven sessions of trading remaining, July is at risk of a monthly candle with a long upper wick. If the month closes near Thursday’s close (376.76) – or lower – the candle would have shown up after a rip-roaring 52.6-percent jump from last October’s low. At one point on Wednesday, the ETF was 5.3 percent from the all-time high of 408.71 from November 2021 (Chart 1).
Sellers showed up at trendline resistance of an ascending channel from last October. With a day’s trading left, the weekly is on the verge of forming a shooting star right on resistance.
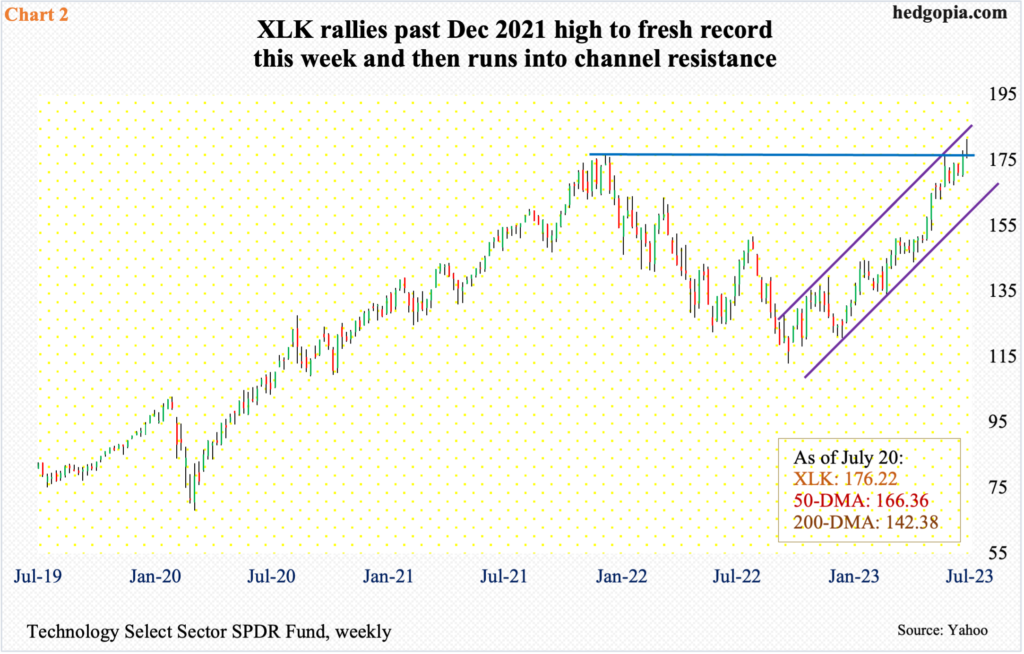
XLK (Technology Select Sector SPDR Fund) faces a similar risk. On the weekly, with four sessions gone this week, a gravestone doji has formed. This, as is the case with QQQ, would have shown up at the upper end of a rising channel from last October’s low. From that low through Wednesday’s new high, the ETF shot up 60.6 percent. This is much better than QQQ’s performance.
Further, as previously explained, at Wednesday’s high, QQQ was 5.3 percent short of the record high posted in November 2021. Back then, XLK peaked at 177.04 in December before collapsing. The ETF took out that high on Thursday last week. Momentum picked up this week where it left off. By Wednesday, a new high of 181.46 was posted, before selling began. At 176.22, XLK closed Thursday a tad under its prior high from December 2021.

Both QQQ and XLK are tech-focused ETFs. The variance in year-to-date performance between the two is interesting.
First of all, equity as an asset class has left many other asset classes in the dust this year. Within equity, in the S&P family, the Large Cap Index (500) is up 15.3 percent, the Mid Cap Index (400) 10.4 percent and the Small Cap Index (600) 8.2 percent.
Of the 11 S&P 500 SPDR sector funds, XLK leads with a 42.2-percent surge, while XLU (utilities) lags with a 2.9-percent loss.
As to XLK versus QQQ, the former is lopsidedly reliant on Microsoft (MSFT) and Apple (AAPL), which have been assigned a weighting of 23 percent and 22.8 percent, in that order (Chart 3). In contrast, within QQQ, they respectively account for 12.9 percent and 12.1 percent; the other three in the top five are Nvidia (NVDA), Google owner Alphabet (GOOG) and Amazon (AMZN), with weights of 7.4 percent, 7.2 percent and 6.8 percent respectively. Within XLK, NVDA accounts for five percent, while both AMZN and Alphabet are in other ETFs, leading XLY (consumer discretionary) and XLC (communication services) with weights of 22.5 percent and 21.9 percent respectively.
Both QQQ and XLK are afflicted with over-reliance on just a few winners. It turns out, XLK is even more lopsided. In this regard, this week’s potential reversal is worth watching. In the case of XLK, back in December 2021 as well, it made a new high then reversed hard in a shooting star week.
Thanks for reading!
