
The 10-year T-yield is itching to move lower – at least near term – if nothing else just to unwind its overbought condition. This could have implications for tech shares and gold, among others.
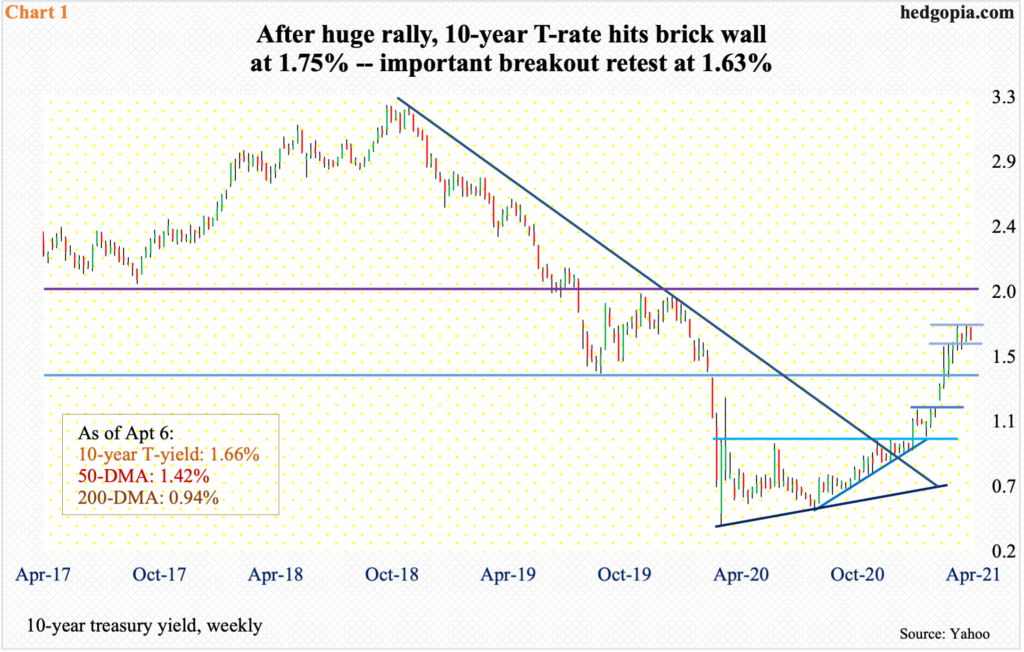
The 10-year treasury yield is beginning to give out signs of fatigue. These rates have had a massive rally, having bottomed at 0.4 percent in March last year. Momentum shifted into a higher gear after resistance at one percent fell early this year, followed by 1.2 percent mid-February, 1.4 percent toward the end of that month and then 1.63 percent mid-March (Chart 1).
Shortly after that breakout, the 10-year tagged 1.75 percent a couple of times, before printing 1.77 percent on March 30, followed by a brush against 1.75 percent a couple more times. In essence, resistance at 1.75 percent has proven tough the past three weeks. Bond bears (on price) hope rates are just resting here. If so, a breakout at 1.75 percent would just about ensure a march toward two percent.
From this standpoint, the 10-year is essentially in no-man’s land currently. It closed Tuesday at 1.66 percent and a breakout retest at 1.63 percent probably lies ahead. A failed test opens the door to a test of 1.4 percent. The 50-day moving average, which is now sharply rising, lies around there at 1.42 percent.
This latest behavior on the long end of the treasury yield curve is taking place at a time when economic growth is picking up speed. At the March 16-17 FOMC meeting, the Fed raised its real GDP growth forecast to 6.5 percent this year, up from 4.2 percent last December; core PCE inflation forecast went from 1.8 percent to 2.2 percent.
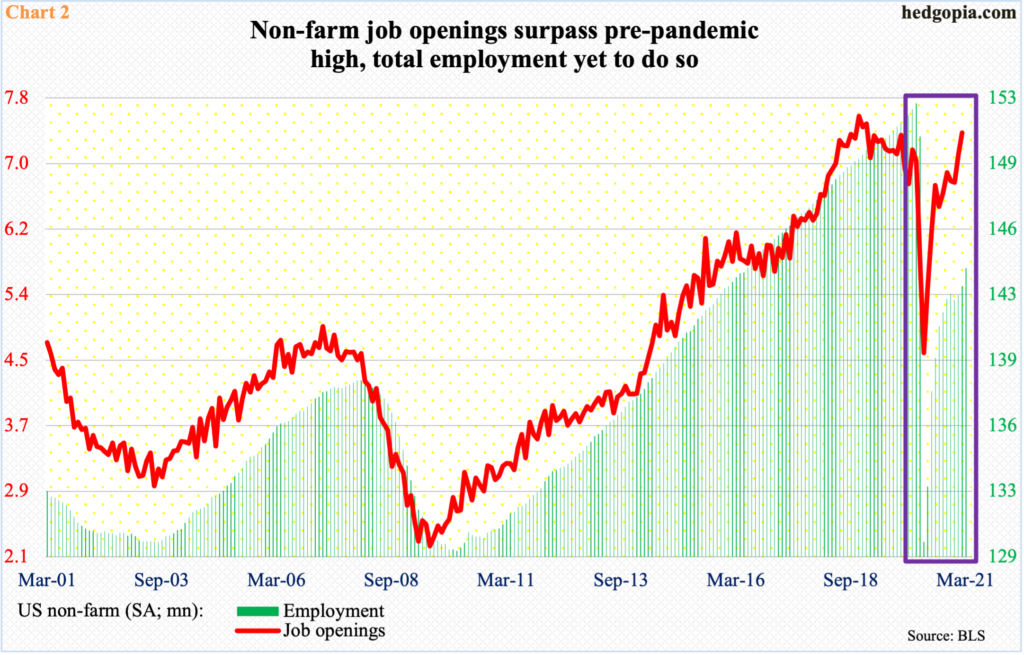
In March, the economy added much-better-than-expected 916,000 non-farm jobs, to 144.1 million. Since last April, 14 million new jobs have been created. Although, there are still 8.4 million fewer jobs from the pre-pandemic record high of 152.5 million reached in February last year.
Job openings, however, have exceeded that threshold, with February seeing 268,000 new openings, to 7.37 million, versus 7.15 million in January last year (Chart 2).
The inability of the 10-year yield to continue to rally in the face of strong macro data could be telling. If the latest sideways move resolves downward, there could be repercussions for a whole host of assets, not the least of which are equities.
Tech has lost its mojo this year. True, in the wake of the November 3 presidential election and particularly after Pfizer (PFE) announced its positive vaccine news on the 9th that month, followed by Moderna’s (MRNA) a week after that, there has been a growth-to-value shift beginning last November. But beginning January, signs of distribution are appearing.
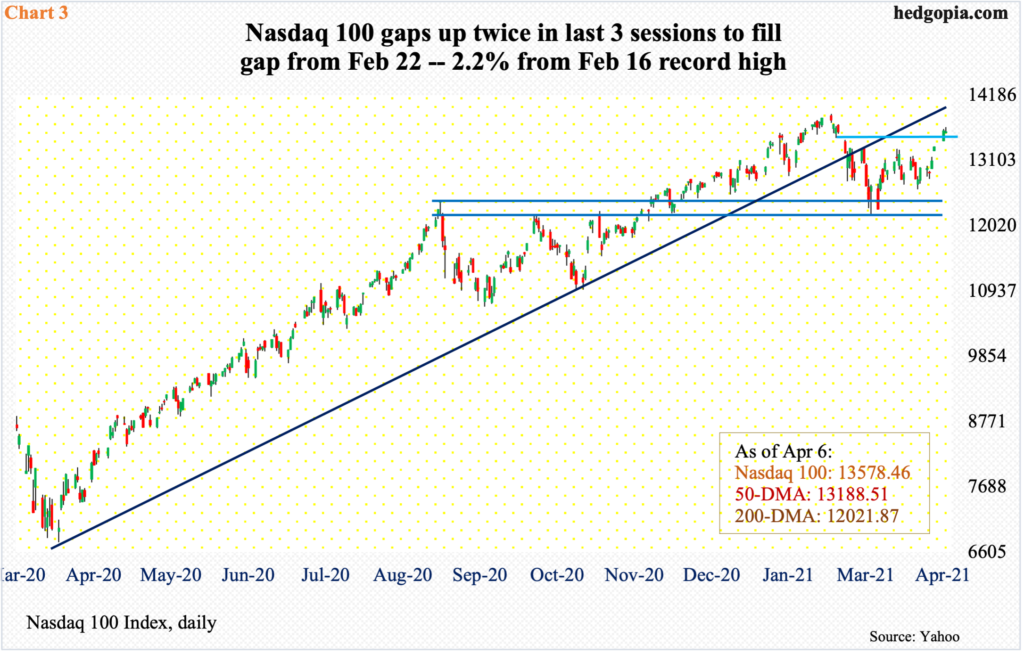
On the Nasdaq 100, January produced a long-legged doji, February a shooting star and March a dragonfly doji. This followed a 105-percent surge from the low of March last year (monthly chart here). The index also lost a rising trend line from that low (Chart 3).
After losing 12 percent between its February 16 record high of 13879.77 and March 5 low, the Nasdaq 100 (13578.46) put in a higher low on the 25th, reclaiming the 50-day last Thursday with a gap-up. Tuesday, it gapped up again to fill a gap from February 22. If the prevailing thinking that tech has been hurt by higher rates is right, then a potential drop in the 10-year yield should act as a tailwind. The Nasdaq 100 is 2.2 percent from its all-time high.
The other major asset class worth watching is gold.
In the 12 months to February, core PCE (personal consumption expenditures), which is the Fed’s favorite measure of consumer inflation, rose 1.41 percent, down from 1.48 percent in January. But the trend more or less has been higher since last April when inflation dropped to 0.93 percent. The Fed itself expects higher inflation in the months ahead, although it views this as transitory.
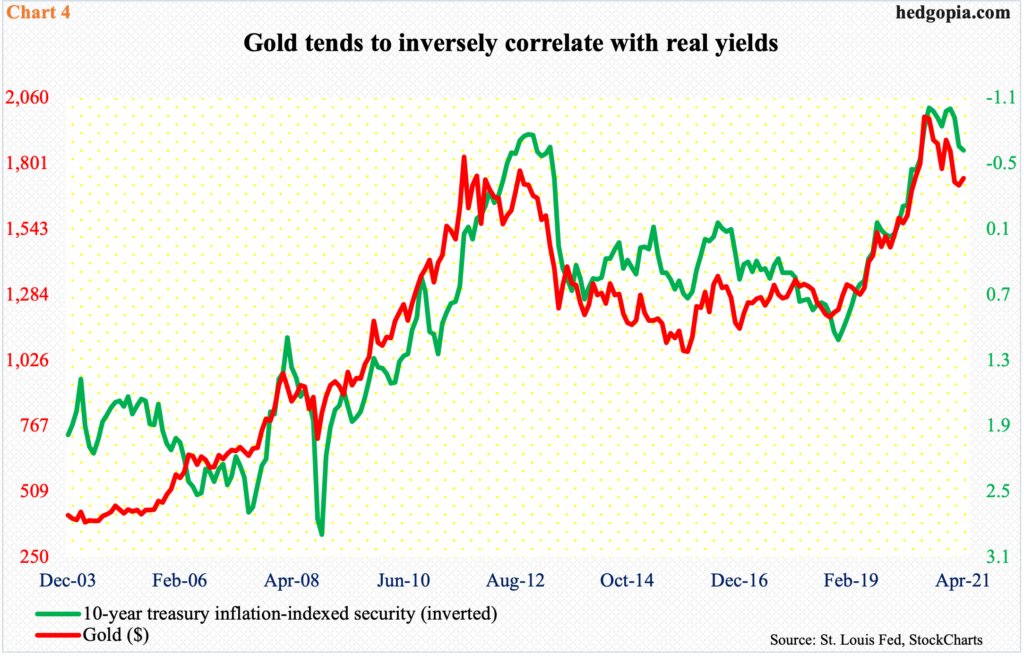
A combination of rising inflation and falling rates will impact real rates, which are a huge driver of gold prices. Chart 4 plots the 10-year treasury inflation-indexed security – debt securities with coupon and principal payments indexed to inflation – with the yellow metal. The relationship is quite tight.
The dynamics, of course, change if the 10-year yield breaks out of 1.75 percent and charges toward two percent.
Thanks for reading!
