
The S&P 500 posted a new record last Thursday; otherwise a laggard this year and March in particular, the Nasdaq 100 too reclaimed its 50-day. Continued strength in tech should reverberate through the rest of the market, particularly market cap-weighted indices such as the S&P 500.
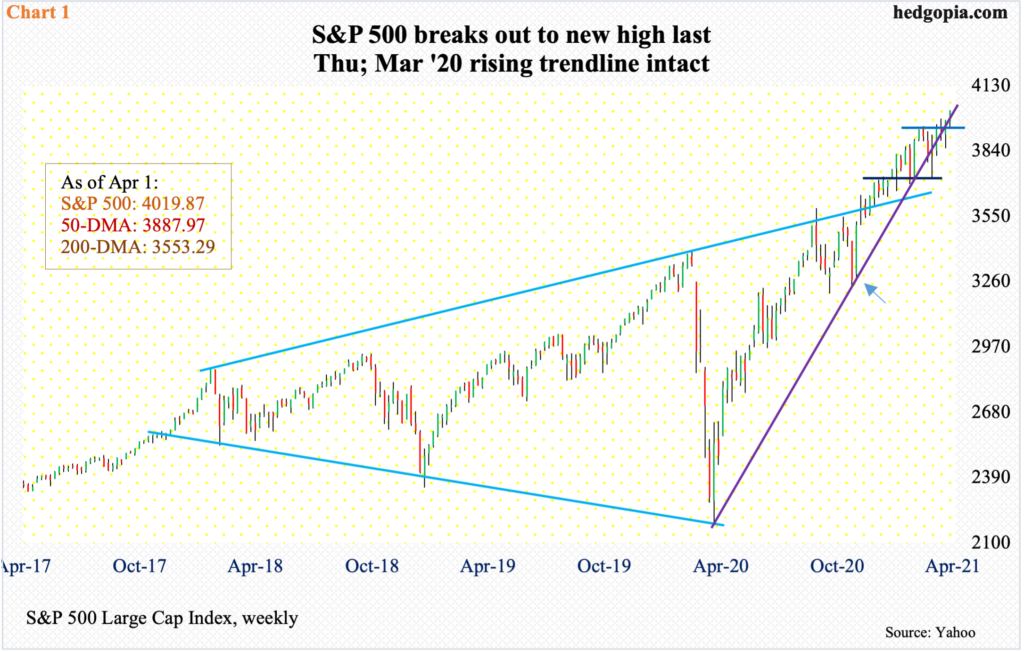
The S&P 500 broke out to a new high last Thursday.
Since late January, the 50-day moving average has been defended three times, the last of which occurred six sessions ago. From that low through last Thursday’s high, the large cap index (4019.87) quickly rallied 4.4 percent. Bulls now have new support at 3980s, or just below at 3950s.
Despite repeated tests, they have so far managed to save a rising trend line from the low of March last year. There was a genuine intraday break five weeks ago, but bids showed up at 3720s to close the week right on that support (Chart 1).
Volume has been a suspect all along, including last Thursday. Last week’s breakout also came in the midst of offensive sectors beginning to act defensive.
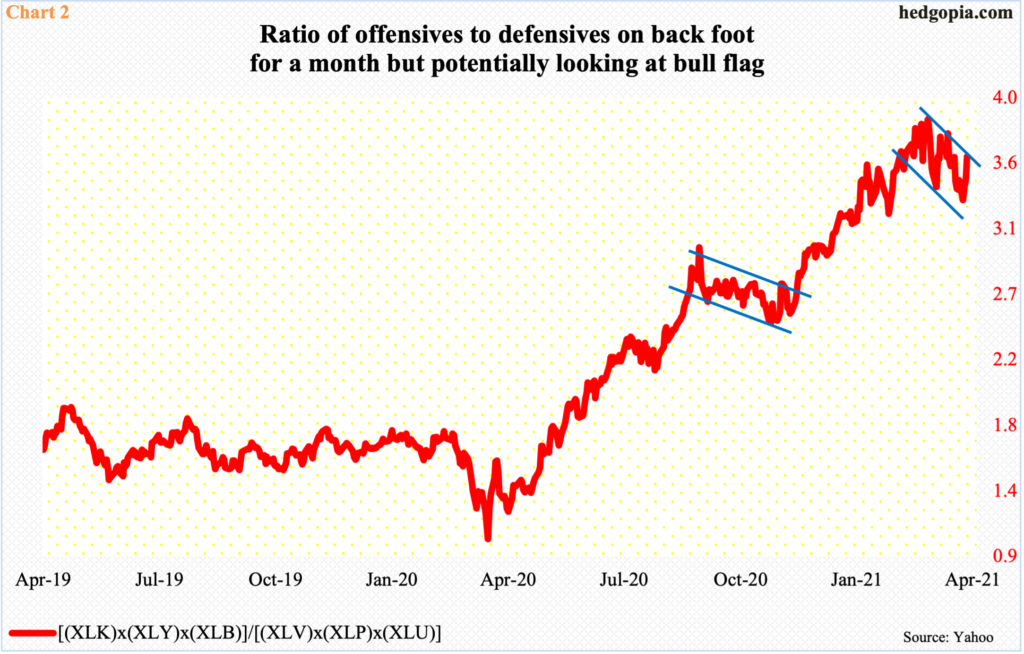
Chart 2 uses six SPDR sector ETFs to plot a ratio between offensives and defensives. XLK (technology), XLY (consumer discretionary) and XLB (materials) are used as offensive sectors and XLV (health care), XLP (consumer staples) and XLU (utilities) as defensive.
The ratio peaked on March 1 at 3.86, before getting caught in a pattern of lower highs and lower lows. Last Thursday, it closed at 3.60 – right at the upper bound of what looks like a bull flag. Bulls would love a breakout at this juncture. A similar setup resulted in a breakout mid-November last year.
Right around that time – mid-December, to be precise – US money market funds bottomed at $4.29 trillion. As of last Wednesday, these assets were sitting at $4.50 trillion. The so-called cash-on-the-sidelines kept accumulating even though the S&P 500 rallied strongly post November 3 presidential election and particularly after Pfizer (PFE) announced its positive vaccine news, followed by Moderna’s (MRNA) similar announcement one week after that (arrow in Chart 1).
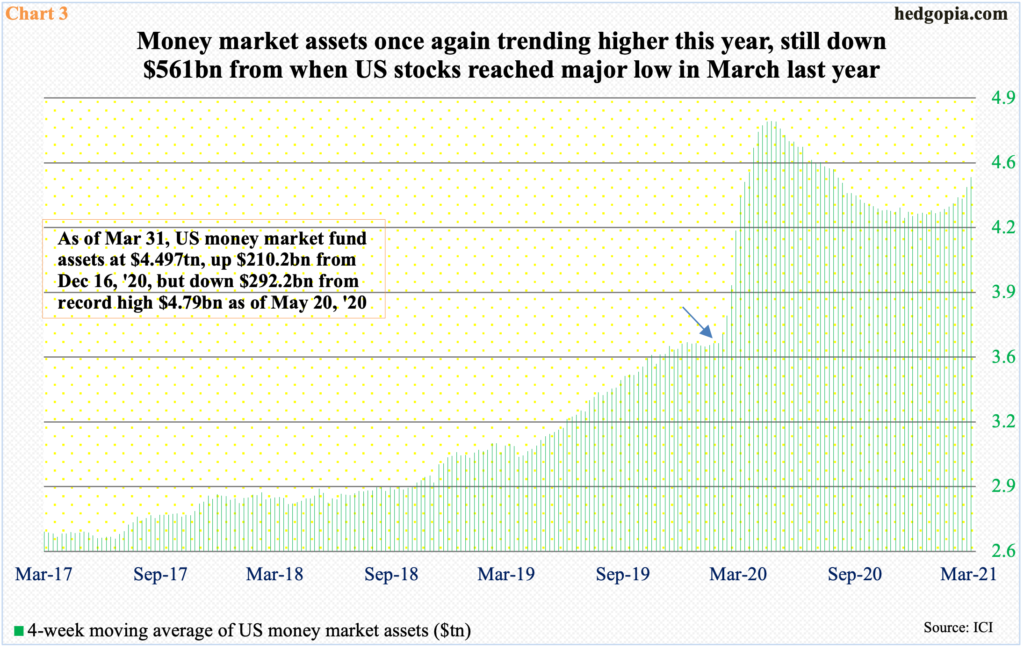
As a matter of fact, this phenomenon has been going on since stocks reached major lows in March last year. In the week to March 18, 2000, these funds held $3.94 trillion in assets; the S&P 500 bottomed on the 23rd that month and went on to rally 82 percent. These assets, however, rose by $561 billion during the period (arrow in Chart 3).
This is not exactly a vote of confidence equity bulls would like to see. That said, after peaking at $4.79 trillion in the week to May 20 through mid-December, these funds did contract by $503 billion, before rising again. A similar contraction could potentially help stocks.
Or take investor sentiment, for that matter.
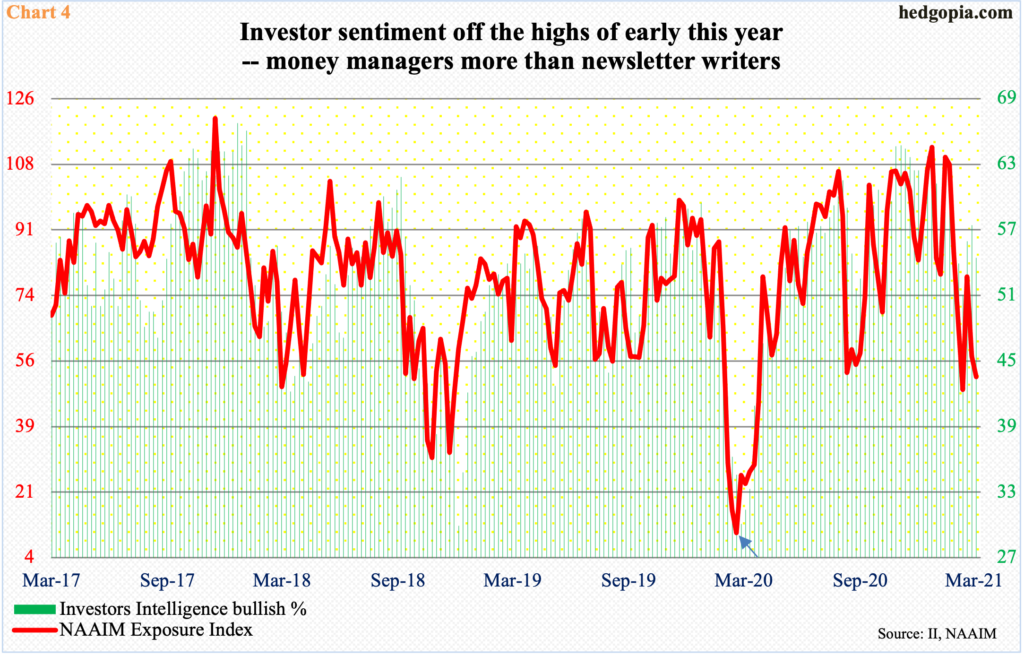
Early this year, sentiment was effusive. Through the week to January 27, Investors Intelligence bulls were north of 60 percent for 10 weeks in a row. Sentiment decisively perked up after November. Similarly, between mid-November and mid-February – that is, 14 weeks – the NAAIM Exposure Index stayed north of 100 for nine weeks. Readings above 100 are rare. Going back to July 2006, there have been 29 100-plus readings.
Sentiment has cooled off. As of last Wednesday, the NAAIM index, which measures National Association of Active Investment Managers members’ average exposure to US equities, stood at 52. As of last Tuesday, newsletter writers, as measured by Investors Intelligence, were 54.4 percent bullish. This is not exactly a panicky territory as was seen during the lows of March last year (arrow in Chart 4) but suppressed enough it can swing back up.
At least that is what equity bulls are hoping for, particularly given last week’s breakout in the S&P 500.
One thing going for them is the earnings revision trend.
First of all, sell-side analysts are notorious for starting out optimistic and then lower their numbers as the year progresses. This was also evident last year.
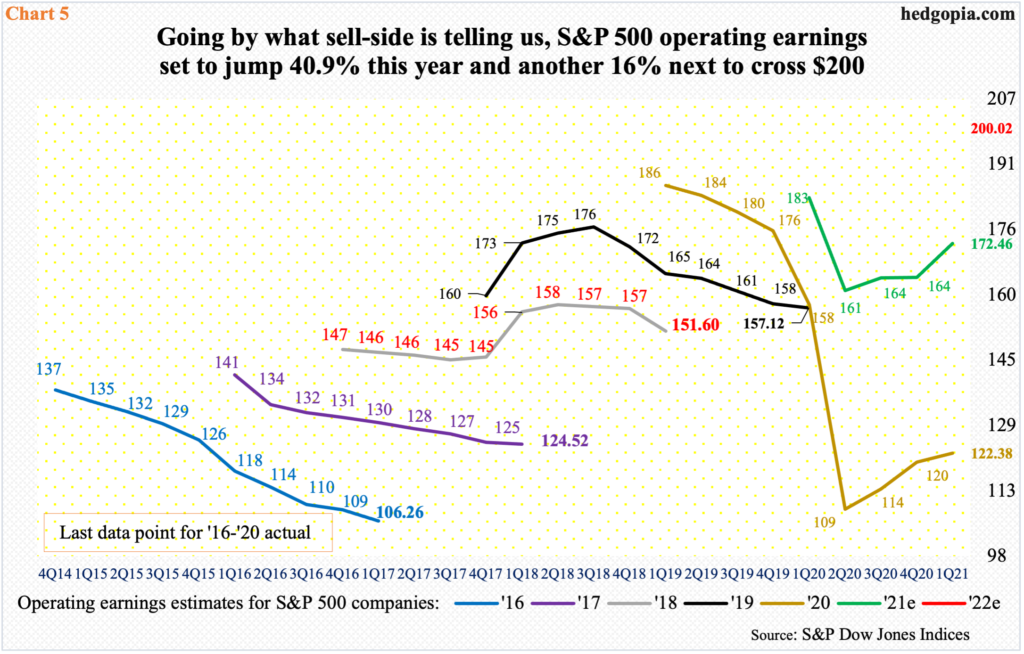
In March 2019, they had penciled in $186.36 in 2020 operating earnings estimates for S&P 500 companies. Then the knives came out. Estimates gradually trended lower, reaching $173.04 at the end of February last year, before the bottom fell out as Covid-19 hit; in early July, this year’s estimates were down to $108.86. It turns out they were too pessimistic at that point in time, with the year ending in $122.38 (Chart 5). Around the same time, estimates for this year began to hook up – from $160.89 mid-July to $172.46 at the end of March this year. If this year’s estimates come through, earnings would have shot up 41 percent, followed by another 16 percent increase next year, to $200.
Time will tell if this optimism pans out. Right here and now, however, longs can hang their bullish hat on the prevailing positive revision trend.
Near-term, last week’s breakout on the S&P 500 raises the odds that bulls will continue to carry the momentum. All the better if tech joins in. The Nasdaq 100, after remaining under the 50-day for a month, reclaimed the average last Thursday. But the tech-heavy index has been on the back foot for a while now. On a relative basis, growth began to lag value last November.
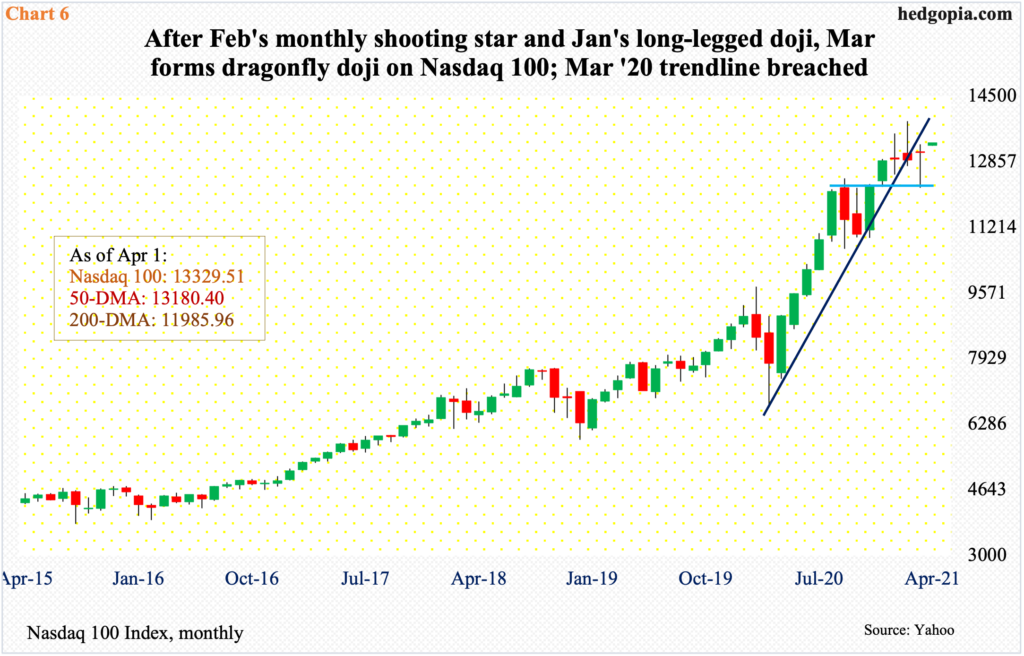
Particularly worrisome are three successive monthly candles. January produced a long-legged doji, followed by a shooting star in February and then by a dragonfly doji in March (Chart 6). This preceded a 105-percent surge from the low of last March. Bulls are sitting on tons of paper gains and it will not be uncommon for them to want to lock them in – at least some. These three candles could be telling us that things are evolving this way. March’s dragonfly doji shows sellers were aggressive but that the buyers were able to absorb all the selling. But the important thing to remember here is that selling picked up speed. This is a medium- to long-term worry.
Near term, from its all-time high of 13879.77 on February 16 through 12208.39 on March 5, the Nasdaq 100 (13329.51) shed 12 percent. It then put in a higher low on the 25th. Last Thursday’s action, therefore, is encouraging in that bulls can at least hope to fill a gap from February 22 at 13540s.
Tech’s participation obviously will help the S&P 500. The sector wields too big of an impact on market cap-weighted indices such as the S&P 500. The top five companies in the index – Apple (AAPL), Microsoft (MSFT), Amazon (AMZN), Alphabet (GOOG/L) and Facebook (FB) account for nearly 21 percent. Those same companies have a nearly 40 percent weight in the Nasdaq 100.
Thanks for reading!
