
The Russell 2000 continues to diverge with small-business profit trend. Having rallied the index 138 percent from the low of last March, bulls are salivating over this year’s consensus profit estimates. In the meantime, on the back foot for nearly 11 months, bears have an opportunity to defend the upper end of a three-month ascending channel.
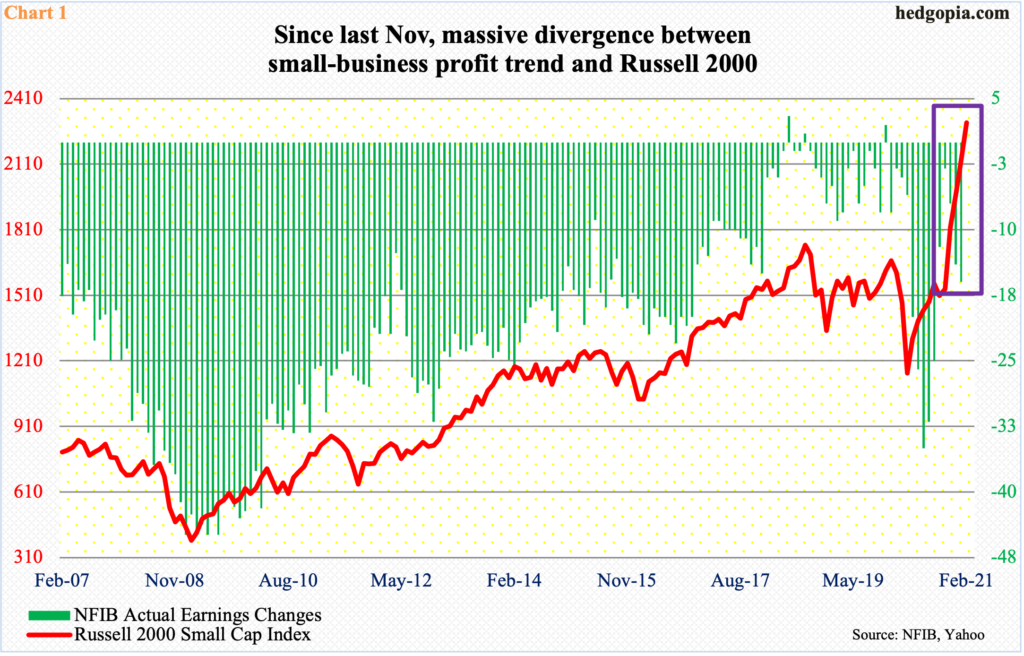
The Russell 2000 Small Cap Index continues to diverge with small-business profit trend. Historically, National Federation of Independent Business’ Actual Earnings Changes sub-index and the Russell 2000 have shown a tendency to move hand in hand (Chart 1). But this changed particularly since late October-early November last year when two major developments occurred simultaneously.
First was the November 3 presidential election. Optimism around President Joe Biden’s spending plan – both stimulus and infrastructure – was cemented further on January 5 as Georgia Senate runoff races were won by the Democrats, giving them control of both chambers of Congress as well as the White House. Second was the announcement by Pfizer (PFE) on November 9 – followed by Moderna (MRNA) a week after that – of positive vaccine news. This massively raised investor hopes that the US economy would come roaring back this year after a 3.5-percent decline in real GDP in 2020.
Small-caps inherently have more domestic exposure than their large-cap cousins such as the S&P 500 Large Cap Index. As the economy suffered a first negative year since 2009, small-cap companies bore the brunt of this contraction last year.
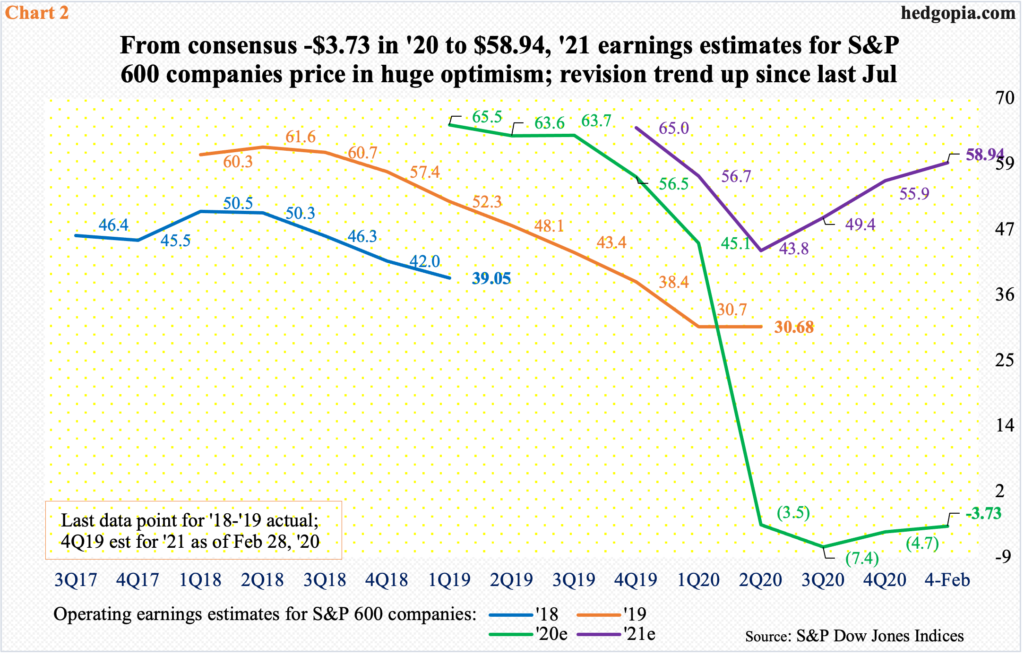
As of last Thursday, with nearly three-fourths of 4Q results in, S&P 600 Small Cap companies were on course for losing $3.73 in operations in 2020, down from earnings of $30.68 in 2019. This is probably what is captured in NFIB’s Actual Earnings Changes sub-index, which deteriorated from minus 14 to minus 16 in January. After collapsing to minus 35 last June, the metric improved to minus three in October before it started to go downhill again (Chart 1).
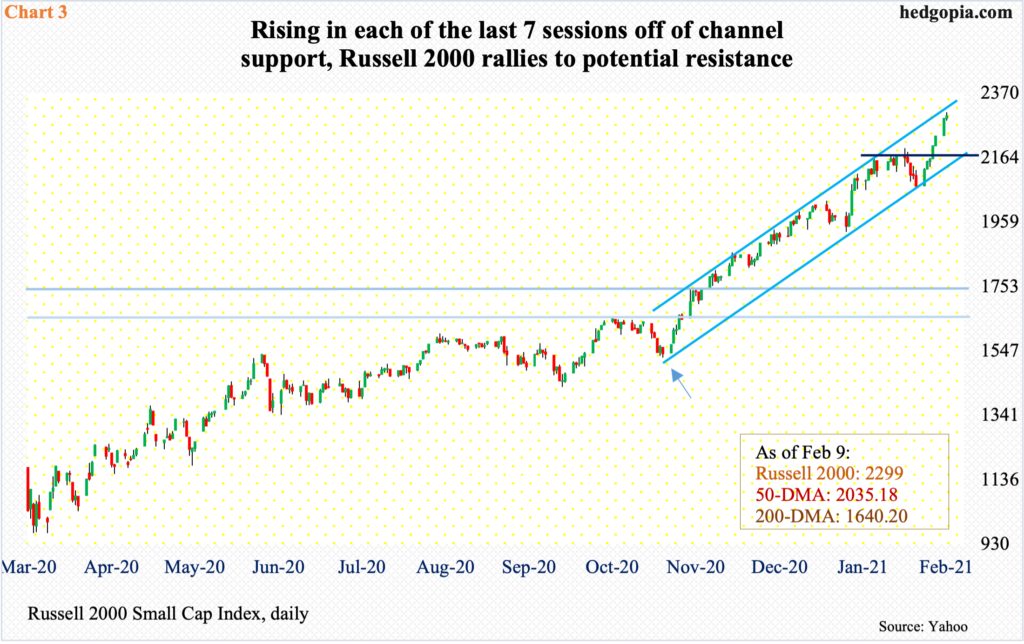
In contrast, the Russell 2000 – already in an uptrend since bottoming last March – has gone parabolic since late October-early November (arrow in Chart 3). Small-cap investors are looking forward. Earnings are expected to go through the roof this year. The sell-side has penciled in $58.94, which is less than the $65 expected a year ago. But that was pre-pandemic. As these analysts brought out the knives to adjust for the virus-spurred dislocations, this year’s estimates were cut to as low as $43 mid-July. The revision trend then turned upward (Chart 2).
Consequently, investors are gung-ho about this year’s prospects.
From last March’s low, the Russell 2000 (2299) is up 138 percent – and up nearly 51 percent just from late October! That is a lot of good news priced in. This in and of itself does not mean the momentum has to reverse. At some point, however, this becomes so lopsidedly bullish that the law of gravity will get to work. On Tuesday, the Russell 2000 was 40.2 percent from its 200-day moving average – a record.
Despite this seemingly unhealthy-looking optimism, apart from some that failed to confirm, there have not been major signs of distribution – yet. Last November, shortly after taking care of 1600-plus, which goes back to January 2018, bulls also reclaimed 1740s, which was the high from August that year. From late October-early November last year, the index has traded within an ascending channel (Chart 3). Late January-early February, it tested the lower end – successfully – and is currently at the upper end.
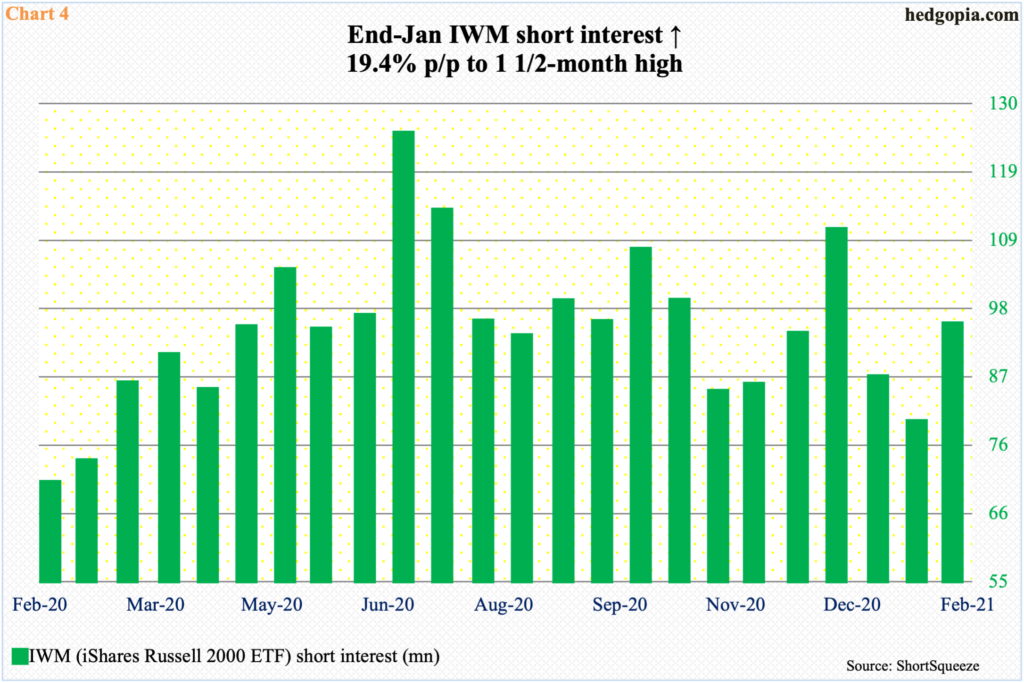
For now, this channel is the one to watch. Bears likely will try to regroup here. Down below, channel support lines up with short-term horizontal support at 2150s. A breach can further embolden the shorts, who aggressively added to their IWM (iShares Russell 2000 ETF) shorts in the second half last month.
At the end of January, IWM short interest jumped 19.4 percent period-over-period to 94.1 million – a month-and-a-half high (Chart 4). Through Tuesday’s intraday high, IWM already rallied 11.7 percent this month – 11.1 percent on a closing basis. So, it is possible these shorts already got squeezed. If they are still hanging tough, this can prove to be an opportunity for the longs if they manage to defend the channel support in question.
Thanks for reading!
