
Here is a brief review of period-over-period change in short interest in the January 1-12, 2018 period in nine S&P 500 sectors.
XLB (SPDR materials ETF)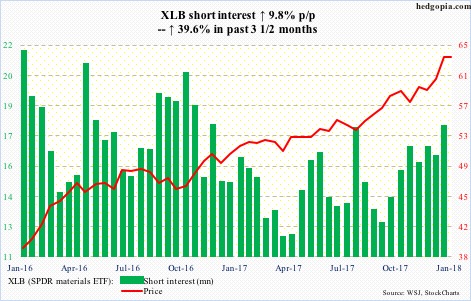
On the 16th this month, XLB (63.39) rose to 63.66 intraday but only to close down with a huge bearish engulfing candle. The 10-day moving average has gone flat since. The bulls are doing their best to save it. Wednesday, they even rallied the ETF to a new high of 63.71, but the session produced a candle with a long wick. Odds favor a test of short-term support at 62.50-ish. The 20-day (62.33) is right there.
XLE (SPDR energy ETF)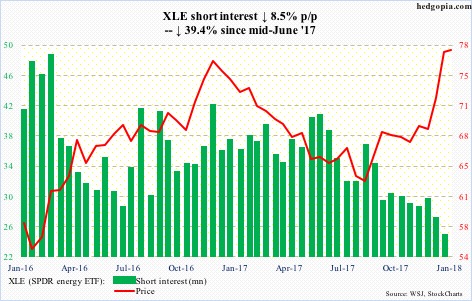
Since bottoming at 61.80 in August last year, XLE (77.70) has come a long way, taking care of one after another resistance. It currently faces one at 77-78, which goes back to October 2007.
There are some signs of fatigue, but the bulls are not giving up, having once again defended the 10-day this week. Wednesday, the ETF was unable to rally on the back of spot WTI that jumped 1.8 percent.
The bears need to take out 77.50 to get traction at least near term.
XLF (SPDR financial ETF)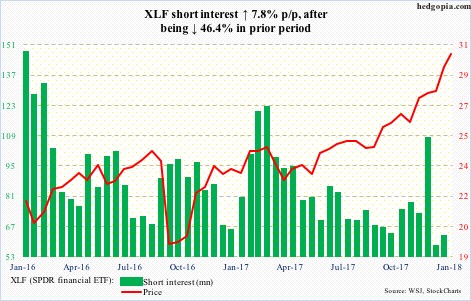
Since breaking out of 28.25 early this month, XLF (30.01) has just about gone parabolic.
Monday, there was a mini break out of 29.50. The bears need to capture that level before even testing the 10-day at 29.40.
XLI (SPDR industrial ETF)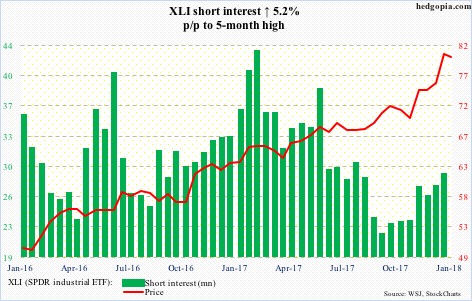
On the 16th, XLI (79.66) rose to a new all-time high of 80.60, but was not able to hang on to the gains, reversing hard with a bearish engulfing candle. It has since gone sideways to slightly down. Wednesday produced a long-legged doji.
The 10-day (79.56) is intact, but vulnerable.
XLK (SPDR technology ETF)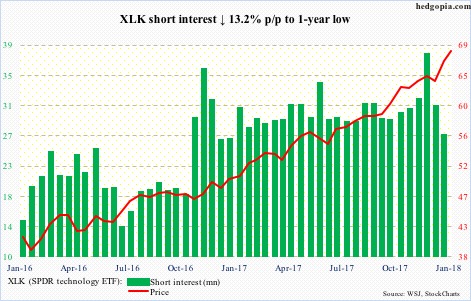
For the last several sessions, XLK (68.23) rallied all along the daily upper Bollinger band. Shorts probably contributed to this, as short interest declined 30 percent in the past month.
As overbought as the ETF is – with monthly RSI of 85-plus – the rising 10-day (67.44) has not even been tested the past three weeks. One is imminent. Wednesday produced a bearish engulfing candle.
XLP (SPDR consumer stables ETF)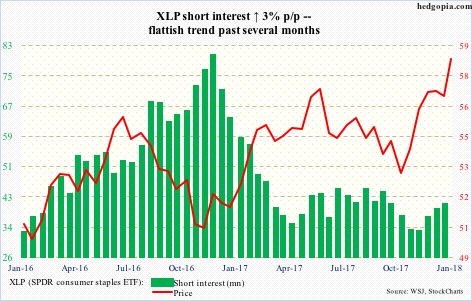
XLP (58.40) broke out of seven-month resistance at 57.30 on the 17th, then rising to a new all-time high of 58.47 this Tuesday. It is currently at the top end of a rising trend line from July 2016 – potential resistance.
As a defensive sector, it has also been a laggard – up 2.7 percent month-to-date versus, let us say, XLY which is up 9.6 percent.
XLU (SPDR utilities ETF)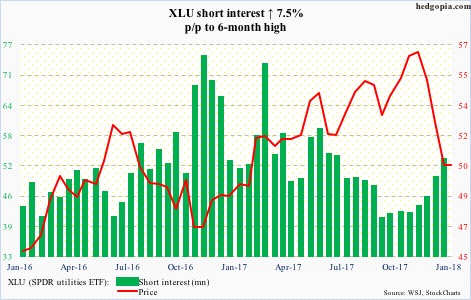
Last November when XLU (50.23) peaked at 57.23, it was repelled at a rising trend line from December 2014. The drop since has been quick and vicious.
Odds favor at least a reflex rally. The daily MACD just crossed over.
In the right circumstances, there is fuel for squeeze. Short interest has gone up 26.5 percent in the past couple of months.
XLV (SPDR healthcare ETF)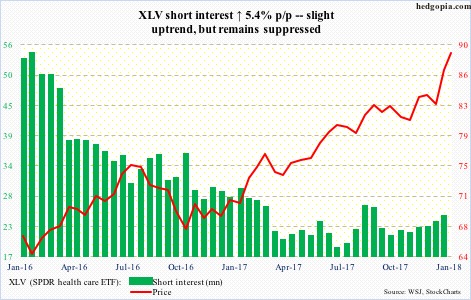
XLV (88.85) was held down by 84 for over two months before conquering that resistance early this month. Once it broke out, it has been straight up – up 7.5 percent month-to-date.
Once again, it has gone sideways near the recent highs. While the bulls would like a mini breakout, there are some signs of fatigue. Immediately ahead, there is support at 88, after that the 10-day (87.71).
XLY (SPDR consumer discretionary ETF)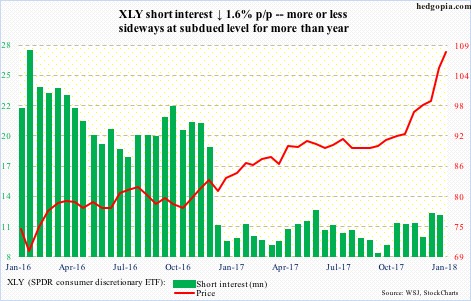
Last November, XLY (108.13) broke out of 92, before rallying 15 percent in no time. This was preceded by another major breakout in January 2017 – out of 82.
Overbought? Yes. The daily RSI is at 87, and the last time the 10-day (105.27) was tested was early this month. With all that said, on Wednesday a long-legged doji showed up right on the upper Bollinger band.
Thanks for reading!
