On the weekly chart, SPY remains grossly overbought, but near term there is room to rally – duration and magnitude notwithstanding. Options can help.
US core PCE (personal consumption expenditures) increased 1.96 percent year-over-year in May – essentially two percent. The last time this metric, which is the Fed’s favorite measure of consumer inflation, rose with a two handle was in April 2012. Also in May, core CPI (consumer price index) rose 2.24 percent y/y. This was the third straight month of two-plus reading. In general, core CPI comes in stronger than core PCE. Most recently, they both bottomed last August at 1.68 percent and 1.30 percent respectively, and have trended higher since (Chart 1).
The Fed has a two-percent inflation target on core PCE, which was just about hit in May. In the June (12-13) FOMC meeting, during which the fed funds rate was pushed up by 25 basis points to 175 to 200 basis points, the dot plot forecasted four hikes this year, up from a forecast of three during the March (20-21) meeting. Rates were also raised in the March meeting. If the FOMC forecast comes true, two more hikes await us in the remaining four scheduled meetings this year. In the futures market, September (25-26) currently has 72-percent probability of a 25-basis-point hike, while December (18-19) is on the fence. Two additional hikes in the remainder of the year puts the fed funds rate at 225-250 basis points – obviously not as accommodative as when the Fed began hiking in December 2015. But is it restrictive? Too soon to tell, but arguably bond vigilantes are beginning to grow concerned.
The recent inflation trend gives FOMC hawks a good cover to maintain a restrictive stance. The long end of the curve, however, has other ideas. Last Friday when May’s core PCE was published, 10-year Treasury yields (2.85 percent) reacted with a yawn. Ditto with the spread between 10- and two-year yields, which inched up one basis point to 33 basis points (31 basis points last Wednesday was the lowest since August 2007). At the highs in December 2015, the yield curve was 137 basis points wide.
Apparently, 10-year yields have struggled to move in tandem with the rise in the short end. Two-year yields (2.52 percent), which reflect markets’ view of monetary policy expectations, were as low as 0.56 percent in July 2016. With that said, although the 10-year rate essentially hit the wall at just north of three percent, it rose from 2.03 percent from last September.
In a leveraged economy, this becomes a factor.
Let us just focus on federal debt for our purposes here. The US national debt currently stands at $21.2 trillion, and rising. The first quarter ended at $21.1 trillion, which is what is used in Chart 2. At a seasonally adjusted annual rate, federal interest payments were $557.7 billion during the quarter. For some perspective, when Great Recession ended in 2Q09, these payments were $372 billion, but debt back then was only $11.5 trillion, for an effective interest rate of 3.2 percent. In 1Q18, the effective rate was 2.6 percent. The red line in Chart 2 is near record low of 2.2 percent recorded in 1Q15. This has suppressed interest payments. Assuming a 100-basis-point rise in interest rates, 1Q18 interest payments would have been $768 billion. Higher rates are increasingly restrictive. Arguably, this is what bond vigilantes are fearful of.
In a scenario in which the Fed continues to tighten and the economy gradually is unable to cope with higher rates, one of the places it begins to get reflected is corporate earnings.
US non-financial corporate debt in 1Q18 was $9.1 trillion, up $89.1 billion sequentially. Since Great Recession, it has gone up $2.6 trillion. Nine years of economic recovery have helped these corporations build a nice cash cushion. S&P Global Ratings’ universe of nearly 1,900 rated non-financial companies ended 2017 with $2.1 trillion in cash and investments. This in all probability is set to decrease in the quarters and years to come, as US companies post-tax cuts repatriate offshore cash home and primarily distribute it to shareholders in the form of buybacks and dividends (more here). This will have taken place at a time when rates are rising, with risks of higher interest payments. Even if the economy continues to hum along, this can potentially take a bite out of operating earnings.
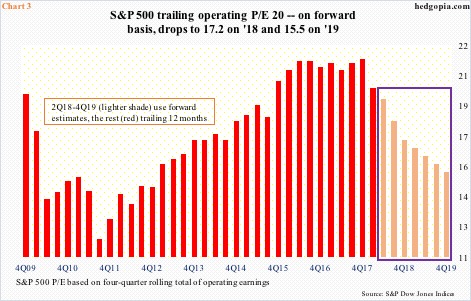
Since late last year, sell-side estimates have gone through the roof. The Tax Cuts and Jobs Act of 2017 was signed into law on December 22. A day prior, 2018 operating earnings estimates of S&P 500 companies were $145.31. As of June 29, they are $157.82 – a new high. Ditto with 2019, which is at $175.02. (These companies earned $124.52 in 2017.) These are heady estimates and obviously assume a lot of good things. Assuming they come through, the P/E multiple shrinks massively, particularly on next year’s estimates (Chart 3), but that is also assuming a lot, especially if the Fed continues to raise the short end of the curve. This is not a scenario US stocks currently envision.
Major equity indices had a nasty drop late January-early February. After plenty of back-and-forth, the Russell 2000 small cap index and the Nasdaq 100 index went on to surpass late-January highs. The Dow Industrials and the S&P 500 large cap index (2718.37) are still below those highs, but they have hardly fallen apart. The latter is merely 5.4 percent from its all-time high, and arguably holding up better than consumer sentiment.
Chart 4 pits the S&P 500 with University of Michigan’s consumer sentiment index. The two more or less move together. Consumer sentiment shot up post-presidential election in November 2016. In October that year, the index read 87.2, jumped 6.6 points the next month and never looked back, with flattish to slightly up since then. Last month came in at 98.2; March’s 101.4 was the highest since January 2004. The S&P 500, on the other hand, went on to rally 34 percent before peaking on January 26 this year.
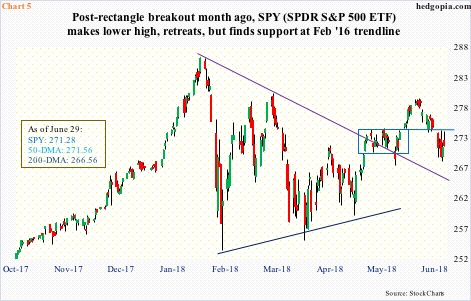
Since that peak, the S&P 500/SPY (SPDR S&P 500 ETF) have made lower highs, accompanied by higher lows since the reversal low on February 9 (Chart 5). A month ago, bulls got excited when SPY broke out of a three-week rectangle, subsequent to which it rallied a decent amount but stopped short of taking out the March 13 high. Last week, sellers persistently showed up just south of $274. Medium term, the weekly chart probably has room to go a lot lower. Near-term is another matter. The daily chart is oversold. Last week, the bulls defended a rising trend line going back to not only this February but two Februarys before that – to February 2016. Our own Hedgopia Risk Reward Index just entered the green zone.
In this scenario, SPY ($271.28) can rally – magnitude and duration notwithstanding. Worse, it drops toward the 200-day moving average ($266.56), which has been defended several times since February. Hypothetically, July 13 SPY 267 short put is selling at $1.40. It is naked, so if put, it is a long at $265.60. Else, the premium is kept.
Thanks for reading!

