
For a change, the VIX-to-VXV ratio has managed to stay overbought longer than what has normally been the case. Signal or noise? We need more time before we have a definitive answer. If it is the signal, equity bulls in due course may be in for a rougher time ahead.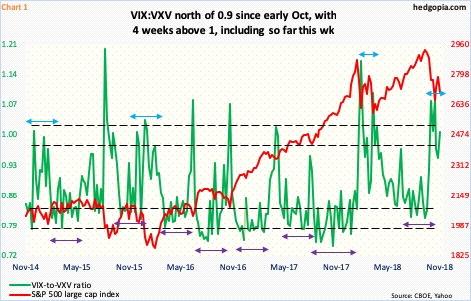
It is possible the VIX-to-VXV ratio is undergoing a regime change. VIX measures market’s expectation of 30-day volatility on the S&P 500 large cap index. VXV does the same, except it goes out to three months. When investors are in risk-off mode, demand for nearer-term protection goes up, which gets reflected in the ratio, as VIX rises more than VXV. The opposite occurs when sentiment shifts to risk-on.
In the bull market that began in March 2009, volatility has persistently remained subdued. Whenever it rose, this was routinely taken as an opportunity to short. And that strategy paid off.
Chart 1 only goes out four years but helps drive home the point. Several times in the past, as soon as the ratio spiked, it quickly began unwinding. That was not the case when the ratio got pushed into oversold territory. Repeatedly, it stayed oversold for several weeks (violet bi-directional arrows).
Most recently, VIX:VXV ended the first week of October at .912, followed by three consecutive weeks of one-plus readings. Then there were a couple of more readings into the .90s, followed by one-plus reading so far this week. The point is, this time around the ratio has remained elevated for seven weeks now, including week-to-date.
Thus the question, is volatility going through a change? It is too soon to answer that question definitively, but it is definitely something worth keeping on the back of one’s head. In January-February this year, as stocks tumbled for a quick double-digit decline, the ratio spiked. After a drop, the ratio jumped again in March, before once again unwinding. A similar phenomenon could be unfolding this time around – or not. Better clues could be found elsewhere.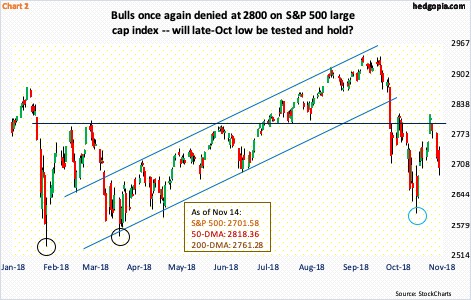
Early this year, the S&P 500 (2701.58) peaked on January 29 at 2872.87, before bottoming at 2532.69 on February 9. It then rallied to 2801.90 by March 13. The subsequent decline troughed at 2553.80 on April 2, for a higher low (black circles in Chart 2).
This time around, the index on October 3 unsuccessfully tested the September 21st all-time high of 2940.91. Then began the waterfall dive, which did not bottom until it hit 2603.54 on October 29 (blue circle). The question is, is the bottom here to stay?
On November 7, the S&P 500 was once again rejected at 2800, and has since come under pressure. Bulls obviously hope the late-October low holds, similar to how things transpired in February-April. A failure to do so would potentially mark a change in sentiment. Shorts got active where they could have – at 2800 – even as both the 50- and 200-day averages are now pointing lower.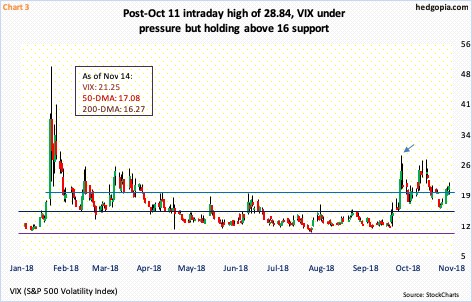
Thus far, the way VIX (21.25) behaves, equity bulls can be given the benefit of the doubt. The volatility index peaked at 28.84 intraday on October 11 (arrow in Chart 3). In the next four sessions, it quickly dropped to just north of 17, before rallying to 27.86 by October 29, for a lower high. During that time, the S&P 500 fell to a lower low. Last Thursday, VIX again dropped to just north of 16, but that support held. The 200-day lies in that area as well.
So VIX essentially is in a no-man’s land, with volatility bulls defending support but bears not allowing a higher high. In the end, VIX could end up being that signal – whether or not the S&P 500 ends up undercutting the late-October low and whether or not the VIX-to-VIX ratio is in the process of a regime change.
Thanks for reading!
