Here is a brief review of period-over-period change in short interest in the Mar 16-29 period in 10 S&P 500 sectors.
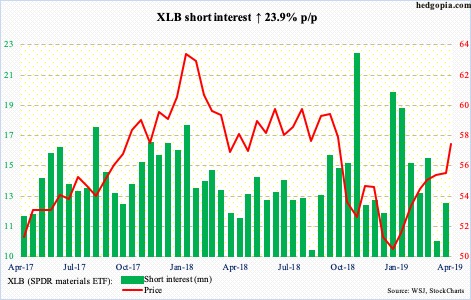
In October last year, XLB (57.42) lost support just north of 56, which then repeatedly rejected rally attempts, including several times in the second half of March. This likely led shorts to add a little during the reporting period. But it is possible they got squeezed.
After finding support at the 50-day moving average late March, XLB opened April with a breakout, rising to 58.05 by last Friday. Near term, breakout retest is the path of least resistance as the daily unwinds its overbought condition.
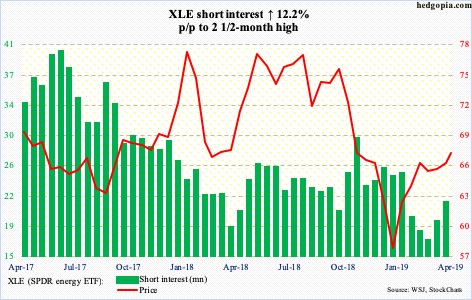
Having gone sideways around 67 for six weeks, XLE (67.08) broke through that ceiling last Friday but with suppressed vigor. Monday, it rallied to 68.25, only to fall back toward 67 in the next session.
The ETF continues to remain sandwiched between the 50- and 200-day (65.57 and 68.89 respectively). Daily Bollinger bands have narrowed quite a bit, which often tends to precede a sharp move – likely down given how extended conditions are.
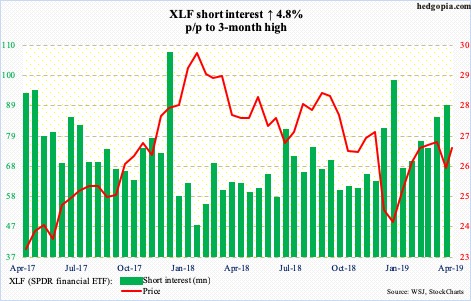
Shorts are getting aggressive. Late March, XLF (26.41) bulls defended major support at 25 but were unable to use that to rally past resistance just south of 27. The 200-day (26.59) lies right around there.
Major financials report 1Q later this week and next. Should these reports be perceived well, there is room for a squeeze. Else, bears would be once again eyeing 25.
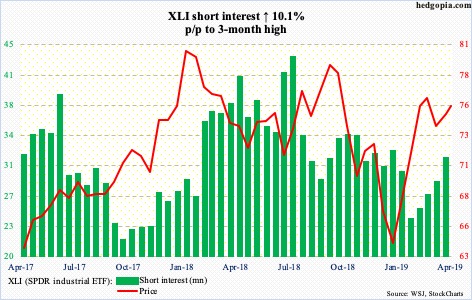
Last Friday, XLI (75.64) was denied at late-February/early-March highs just north of 77. Bulls likely face a crucial test ahead. Just north of 75 lies trend-line support from late December. Just below lies the 50-day (74.69) and then the 200-day (73.23). The latter also approximates horizontal support. It will be a mini-victory of sorts for bears should they manage to reclaim that level.
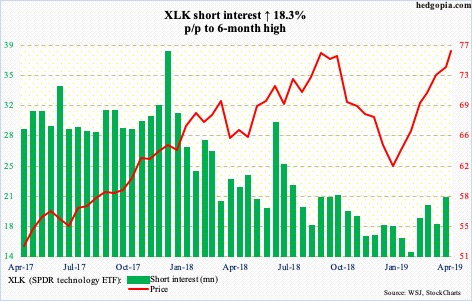
Since reaching 76.26 last Wednesday, XLK (75.85) has essentially gone sideways. This is an important price point. Early October last year, this is exactly where the ETF began its waterfall dive. This time around, it reached that level after rallying in 14 of last 15 weeks. The daily, as well as the weekly, remains way extended. Bears will have an opening should they succeed in pushing the ETF below 75.
XLP (SPDR consumer staples ETF)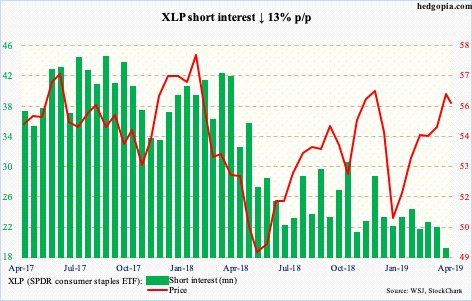
In the last five sessions, XLP (55.75) inched up all along a rising trend line from late December. Risks of a breach are growing. The ETF was rejected early this month just north of 56 – near the highs of last November-December. Trend-line resistance from early January last year lies there as well.
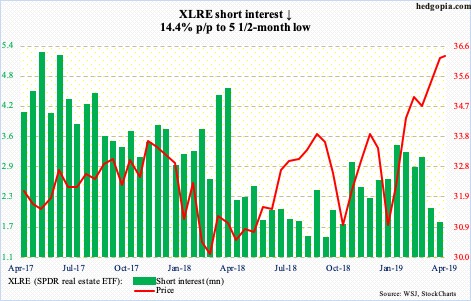
For more than two and a half years, XLRE (36.26) went back and forth within a rectangle, with the upper bound just south of 35. It broke out last month. But building on it has proven difficult. So far this month, April has produced a monthly doji. Breakout retest is the path of least resistance near term.
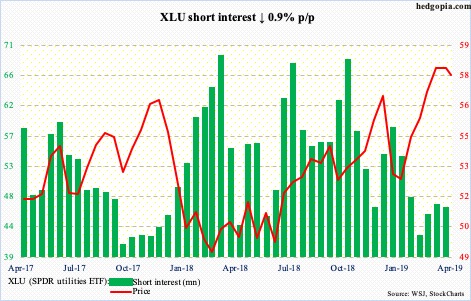
XLU (57.83) has had quite a rally since late December, having gone from 50.81 to 59.07 on March 27. The weakness since that high was bought last week just north of 57. Bulls need to defend this level, which goes back to November 2017. Near term, they probably do not enjoy the fact that shorter-term moving averages are rolling over.
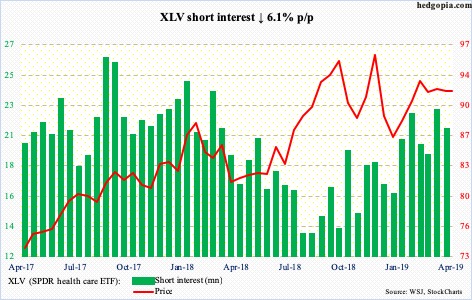
XLV (91.74) is coiling. For a month now, it has traded within a pennant, even as daily Bollinger bands have tightened. This, after a handsome rally off of late-December lows. A decision time is approaching. A breakout has the potential to cause a squeeze. Short interest has gradually built up.
XLY (SPDR consumer discretionary ETF)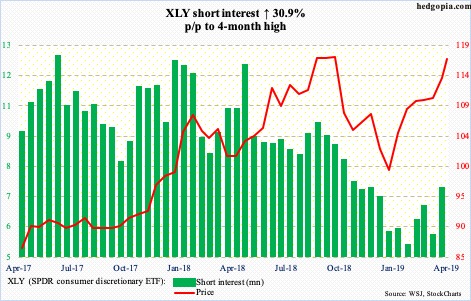
XLY (116.88) Monday came within 16 cents of surpassing its prior high of 118.13 from last October, before coming under slight pressure. This followed a breakout last month at 112. Technicals are extremely extended. In the right circumstances for bears, the best they can hope for right now is a retest of that breakout.
Thanks for reading!

