VIX recently broke a month-and-a-half rising trend line, subsequently coming under more pressure. In the right circumstances for volatility bears, the index could drop more near term, but a longer-term trend line support is unlikely to break.
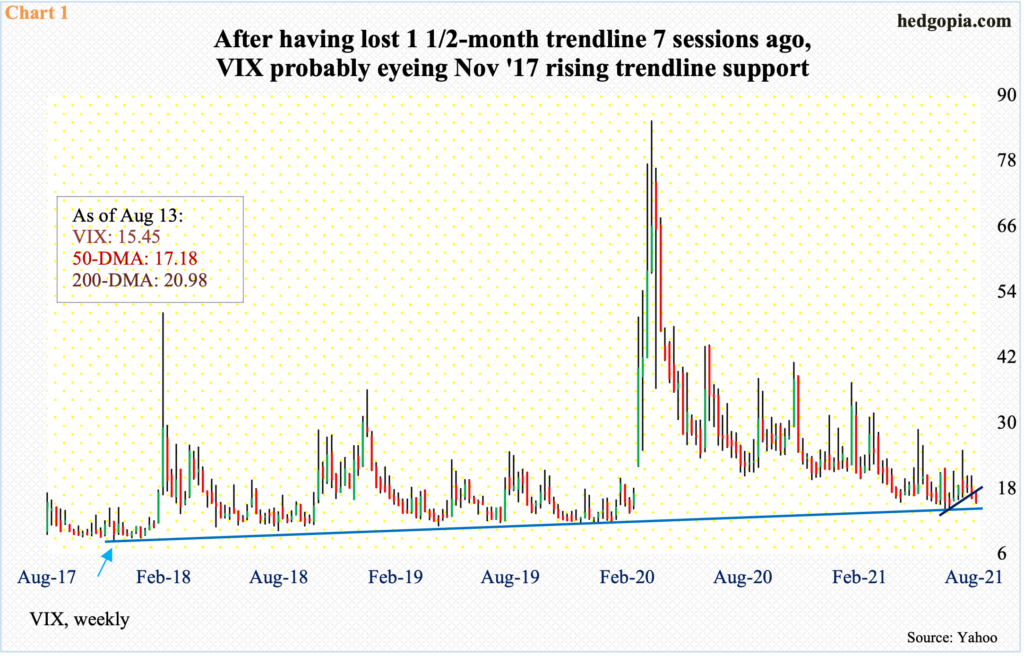
On June 29, VIX posted an intraday low of 14.10, which was the lowest since late February last year, before bottoming just outside the daily lower Bollinger band. Seven sessions ago, a trend line from that low was breached. Since then, the volatility index has come under pressure. Last week, it shed 0.70 points to 15.45.
VIX is already very suppressed. But in the right circumstances for volatility bears, a 14 handle is possible near term.
Longer-term, the picture looks different. On the monthly, VIX is itching to rally. The June 29 low of 14.10 successfully tested a rising trend line from November 2017 when VIX posted record low 8.56 (arrow in Chart 1). That trend line gets tested around 14.40ish. In the event things unfold this way near term, the support should hold.
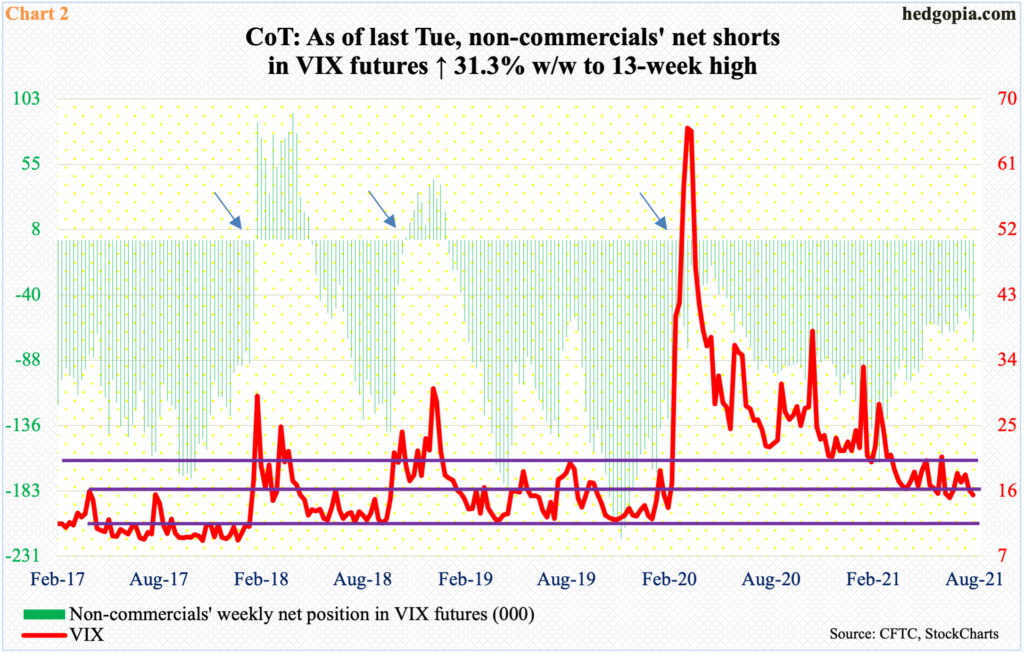
In fact, non-commercials are indeed positioned for a further drop in volatility. As of last Tuesday, they were net short 74,251 contracts in VIX futures, up 17,684 week-over-week. Holdings are at a 13-week high.
Longer term, at some point these traders could end up helping volatility bulls. Several times in the past, spot VIX has tended to bottom only after these traders go either net long or come close to doing so (arrows in Chart 2).
A spike in volatility is coming. It is just a matter of when. Right here and now, sentiment is out-and-out risk-off.
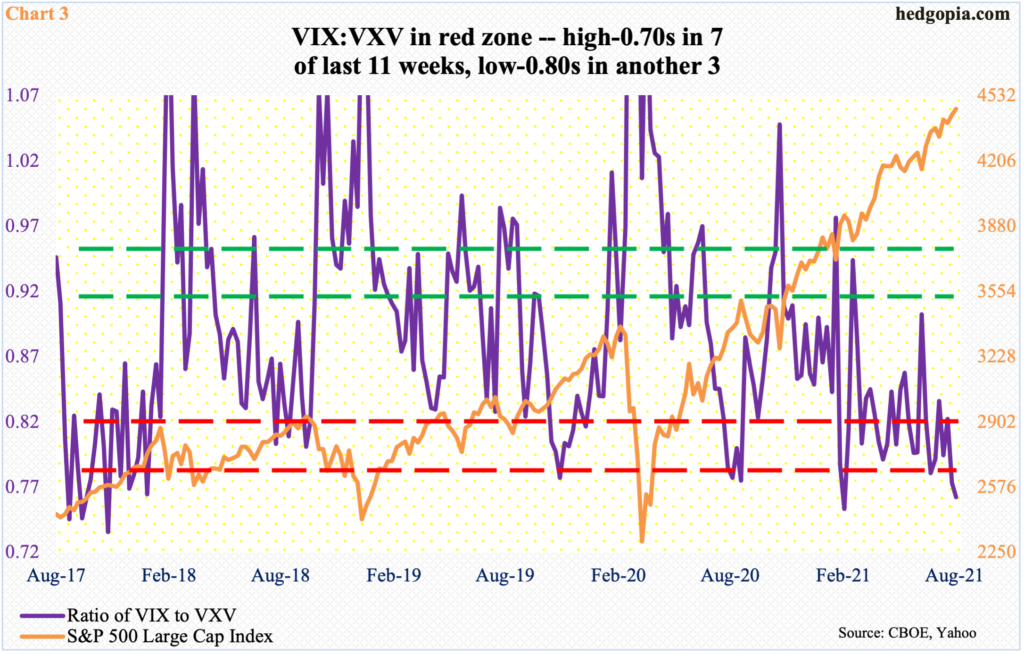
The ratio of VIX to VXV ended last week at 0.76, coming on the heels of the prior week’s 0.77. In the last 11 weeks, there have been seven high-0.70s readings. This is in addition to three low-0.80s weeks (Chart 3).
VIX measures expectations for 30-day volatility using S&P 500 options. VXV does the same except it goes out to 90 days. When traders are in a mood to take on risk, shorter-term contracts lose premium faster, in this case VIX. A lower ratio hence suggests nearer-term volatility is suppressed.
There have been times in the past when the ratio remains suppressed for several weeks/months before it explodes higher. When this happens, VIX rises faster than VXV. This accompanies downward pressure for equities.
VIX behavior still suggests risk-on but other metrics are beginning to show a softening in sentiment.
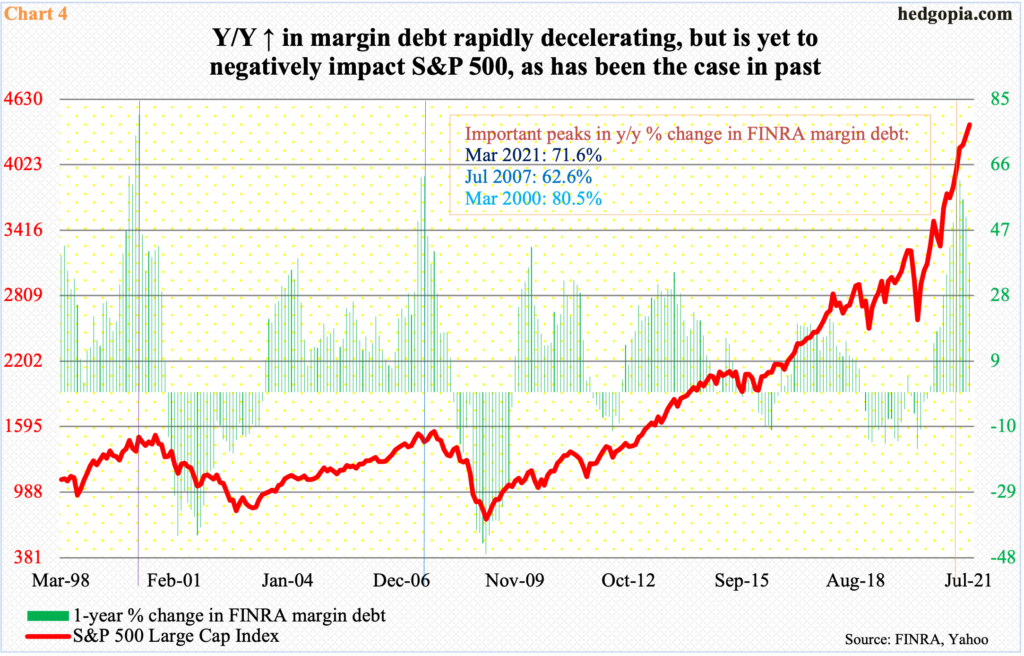
FINRA margin down dropped $37.8 billion month-over-month in July to $844.3 billion. June’s $882.1 billion was a record. July’s drop was the first contraction in 16 months. In March last year, margin debt bottomed at $479.3 billion, then surging 84 percent through June.
Besides July’s m/m drop, margin debt is witnessing rapid deceleration on a year-over-year basis. In July, it grew 37.6 percent. This represents four months of decline in a row, having peaked at 71.6 percent in March (Chart 4).
In July 2007 and March 2000, the y/y growth in margin debt peaked at similar levels before softening, adversely impacting stocks. Thus far in the current cycle, that has not yet happened, with the S&P 500 having risen to a fresh high last Friday. But if investors continue to reduce leverage, it will be hard for stocks to continue to diverge.
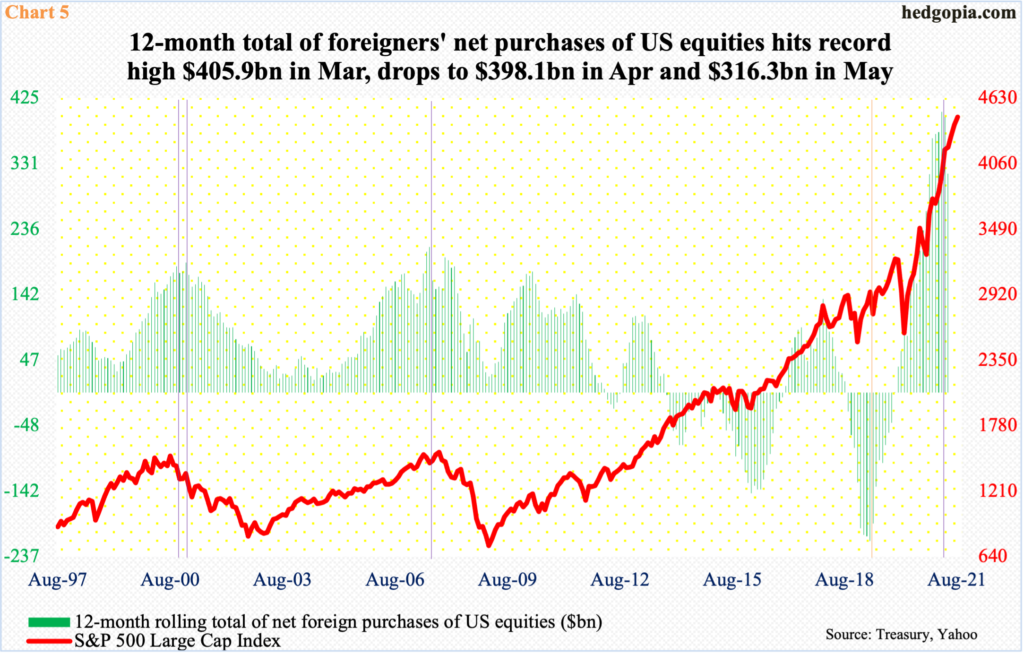
This also holds true with foreigners’ attitude toward US stocks. In April 2019, on a 12-month basis, they were selling $214.6 billion worth, which was a record. By December that year, net selling turned into net buying. US stocks were sold off hard in February and March last year, but foreigners continued to buy. By March this year, the 12-month total rose as high as $405.9 billion, before softening the next two months, with April at $398.1 billion and May at $316.3 billion. June’s data will be released later this afternoon and should shed more light on the underlying trend.
Historically, as is highlighted in Chart 5 by violet vertical lines, there is a tight correlation between foreigners’ action and the S&P 500. In both 2000 and 2007, the two sooner or later moved hand in hand. As is the case with margin debt, the current cycle is showing divergence. However, should foreigners continue to reduce exposure, this should in due course catch up with US stocks.
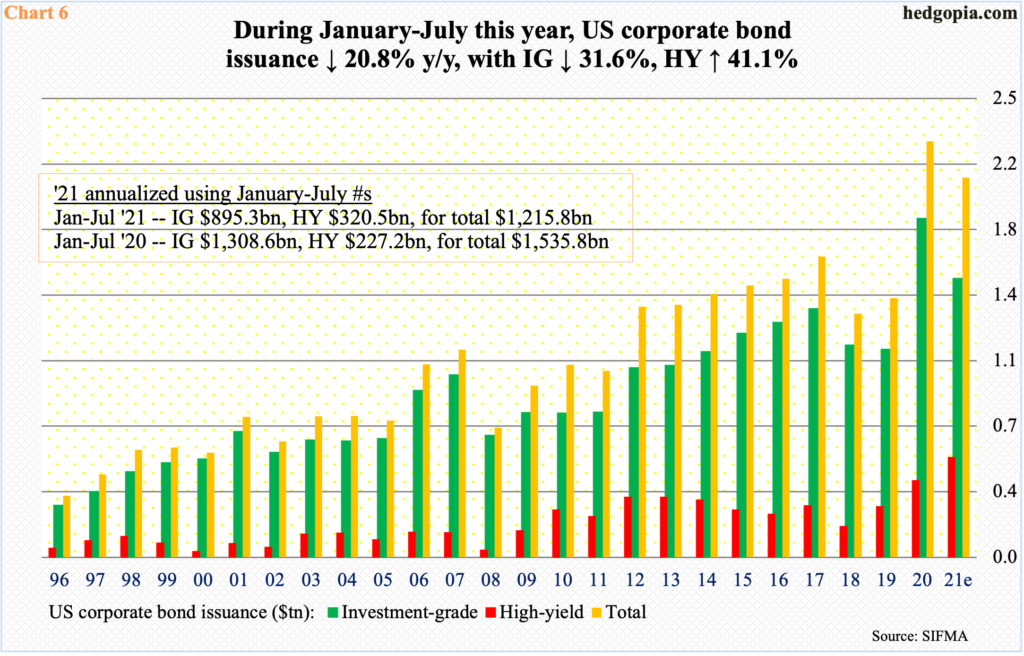
Elsewhere, risk-on is still prevalent. Investor love for high-yield corporate debt has not ebbed. Issuance through July this year was up 41 percent over the corresponding period last year, to $321 billion. Annualized, issuance is on track for 30-percent growth this year, to $549 billion. Should momentum continue in the remaining five months, 2021 will be another record year. At $421.6 billion, 2020 was a record as well (Chart 6).
High-yield’s performance comes amidst softness in issuance of investment-grade, which fell 31.6 percent y/y in the first seven months this year. Issuance is still decent but 2021 is tracking a down year. This is also true with total issuance.
In essence, the message coming from high-yield issuance does not jibe with the ones coming from margin debt and foreigners’ love for US stocks – or a lack thereof. If the recent reversal seen in the latter two sticks in the months ahead, volatility will rise. On the monthly, VIX is itching to move higher.
Thanks for reading!

