Until last Friday’s Jackson Hole speech by Jerome Powell, it was looking like US equities would continue to rally, but post-speech, the potentially rosy outlook got turned on its head.

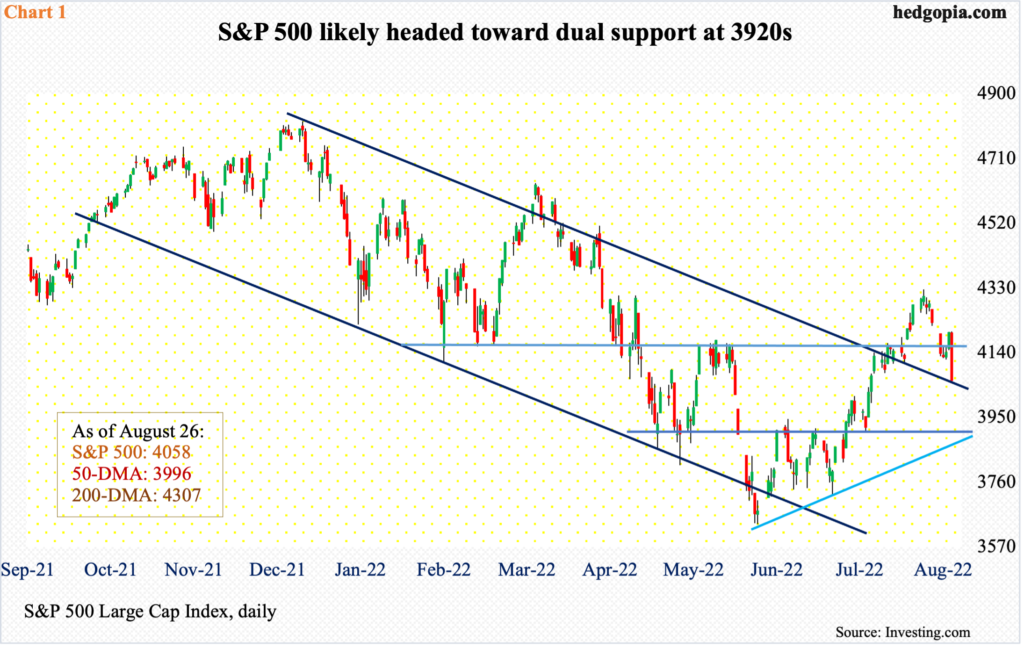
From the June 17 intraday bottom of 3637 to the high on the 16th this month, the S&P 500 rallied 18.9 percent. This preceded a 24.5-percent tumble from January’s (this year) record high 4819. The rally from the June bottom ended at the 200-day, which is slightly downward-sloping and ended last week at 4307.
When sellers showed up at the average, which also coincided with a falling trend line from January, the large cap index had rallied into overbought territory, which was then quickly unwound.
Last week, the index opened with a gap-down, but buyers showed up at 4120s Monday through Wednesday, leading to a rally on Thursday but only to then face a Powell sledgehammer. On Friday, the S&P 500 tumbled 3.4 percent; for the whole week, it was down four percent.
On the weekly, there is room for continued weakness before the overbought condition the index (4058) is in gets unwound. Nearest support includes the 50-day at 3996. After that comes 3920s, which provides dual support – straight line and rising trend line from the June low (Chart 1).

Powell, Federal Reserve chair, in his speech last Friday, strongly pushed back against any notion of a pivot. Post-July 26-27 FOMC meeting, markets began to dial back expectations for rate increases.
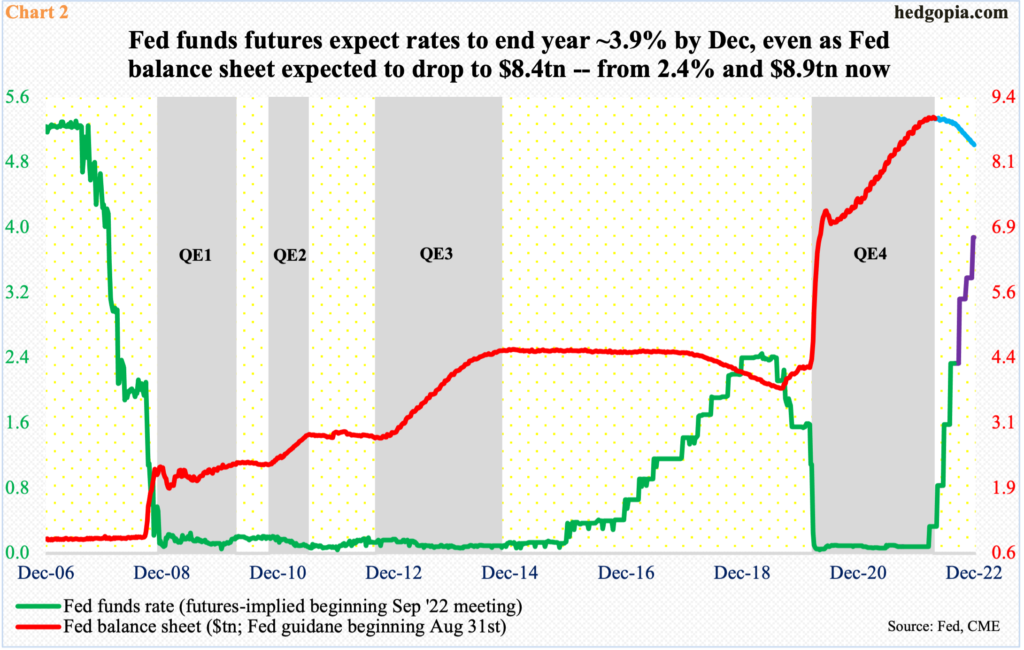
After four rate hikes since March, the fed funds rate currently stands at a range of 225 basis points to 250 basis points.
The central bank’s June forecast projected that the benchmark rates would end this year between 325 basis points and 350 basis points. But after the July meeting, investors began to entertain the idea that the Fed would raise less than forecast.
Friday, Powell delivered a concise but clear message that they plan to stay the course and that bringing inflation under control was not a quick fix.
This is a Fed which now looks solely focused on inflation – ready to contract the economy if the need be. Friday’s reaction in equities was a sign markets are finally beginning to heed. Inflation seems headed lower but remains elevated. The Fed likely pauses after hitting four percent, or higher, with the likelihood that the fed funds rate will then go sideways, with no chance of a pivot.
Traders are adjusting. In the futures market, pre-speech, they were split between 50 basis points and 75 basis points for the September 20-21 meeting; post-speech, the odds for a 75-basis-point hike went up to 71 percent, with 2022 expected to end between 375 basis points and 400 basis points.
The Fed is also tightening by reducing its bloated balance sheet (Chart 2).

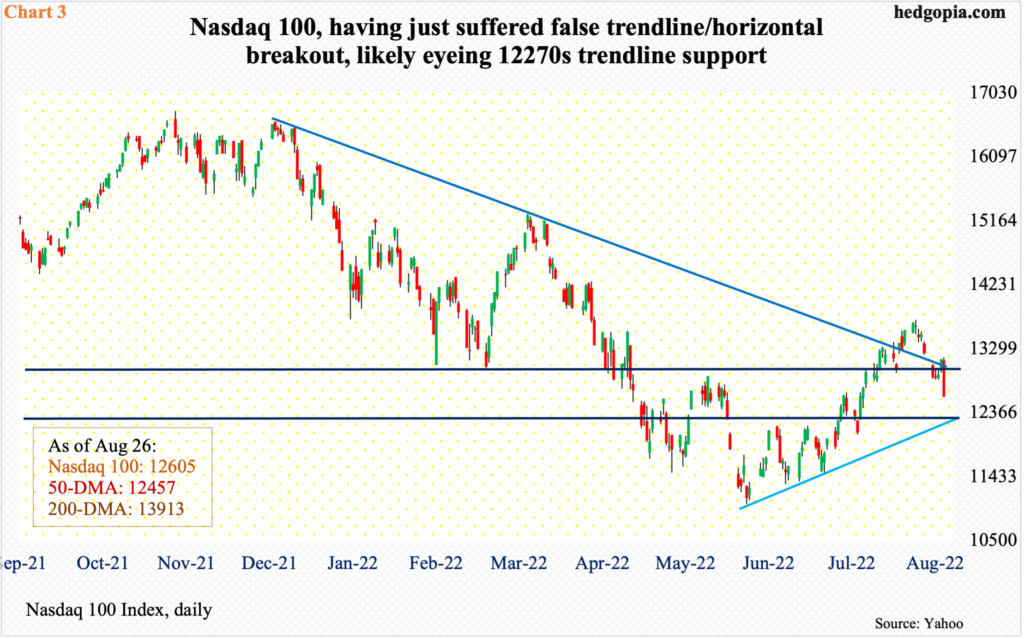
Not surprisingly, tech took it on the chin last week, with the Nasdaq 100 down 4.8 percent. Powell’s commitment to controlling inflation at the cost of jobs if the need be is making growth investors wary.
Until Friday’s smackdown, bulls and bears last week pretty much played a tug of war around 13000, which was lost in Monday’s gap-down. This was followed by bulls’ three consecutive attempts to reclaim the level, with Tuesday and Wednesday failing and Thursday succeeding. Come Friday, it gave way as the Nasdaq 100 plunged 4.1 percent to 12605.
This was preceded by a 2.4-percent drop in the prior week. The back-to-back weekly drop came after four up weeks in a row. Friday’s action has opened the door for the weekly to begin to unwind the overbought condition it is in.
There is trendline support from the June low at 12270s (Chart 3).

Small-caps are no exception. By nature, they are domestically exposed – significantly more than large-caps which can also have overseas exposure. If recession odds grow, small-caps will for sure bear the brunt of it.
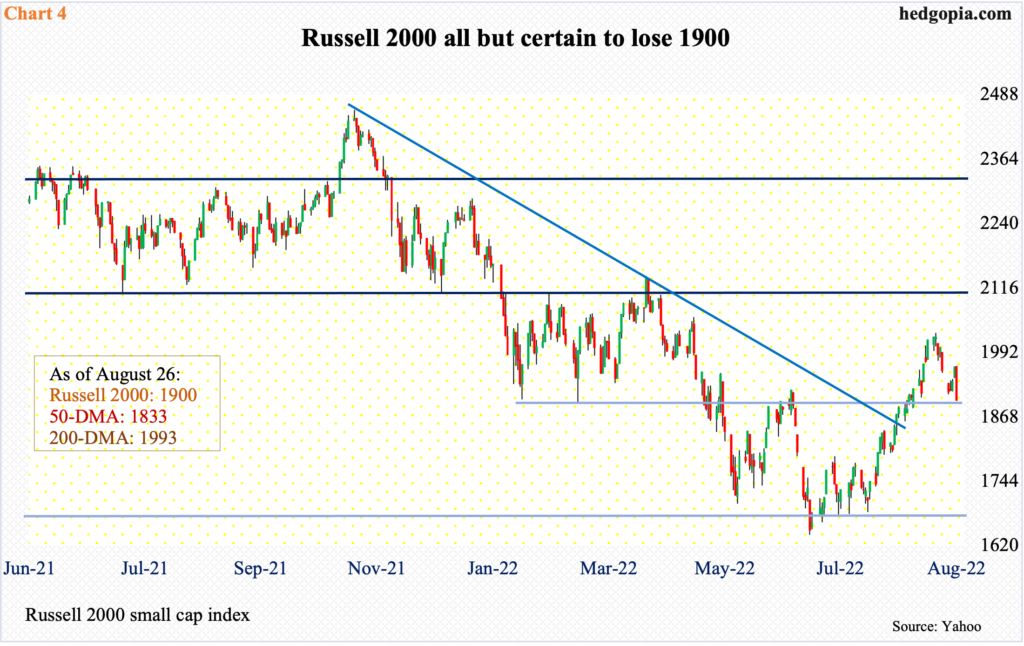
On the 16th (this month), the Russell 2000 tagged 2030 before reversing lower, raising the possibility of a move lower toward 1900.
For perspective, a major breakdown occurred mid-January, losing 2080s; for 10 months, the small cap index went back and forth between 2080s and 2350s, followed by a seesaw action between 2080s and 1900 and between 1900 and 1700 after that; 1700 is where it broke out of in November 2020. The breakout retest was successful (Chart 4).
Last week, the Russell 2000 fell 2.9 percent – same as last week – closing right at 1900, a loss of which is just a matter of time. The only question is if the bears manage to push it all the way down to 1700 or the bulls put the foot down before that.
Thanks for reading!

