The 10-year T-yield just poked its head out of 4.30s resistance. Economic data in recent weeks have come in much stronger than expected. Although it is hard to argue the rally in rates will have staying power – unless, of course, bond bears are finally focused on the chronic issue of the government’s budget deficit, federal debt and the soaring interest payments.
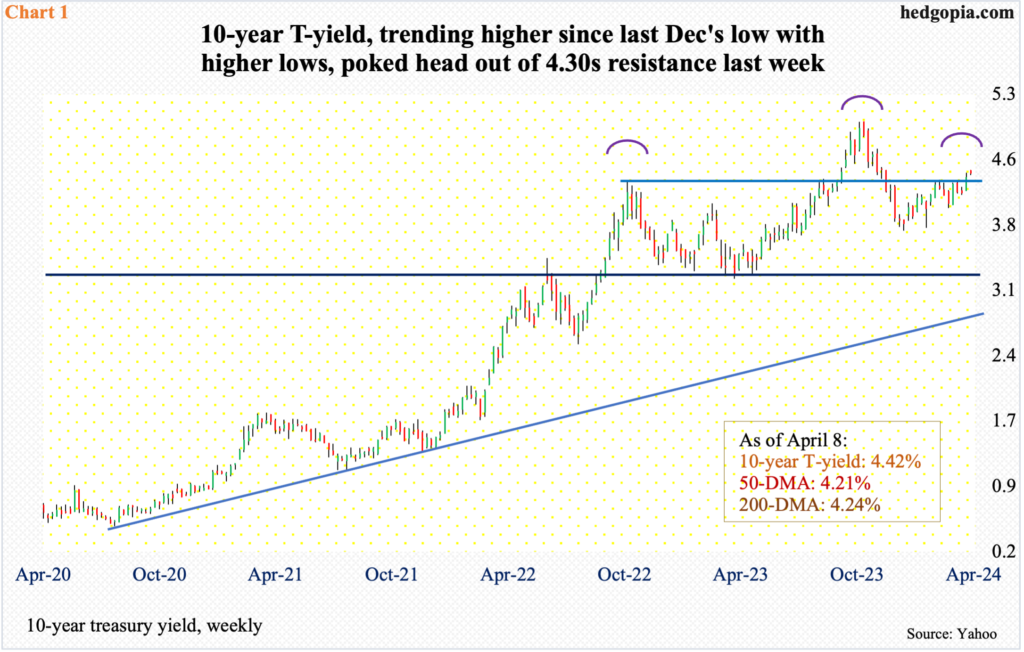
The 10-year treasury yield has a spring in its step. Since bottoming last December at 3.79 percent, it has rallied with higher lows. On Monday, it ticked 4.46 percent intraday before closing out the session at 4.42 percent.
Yields are still substantially below last October’s five percent – the highest since July 2007 – but nudged past horizontal resistance at 4.30s last week (Chart 1).
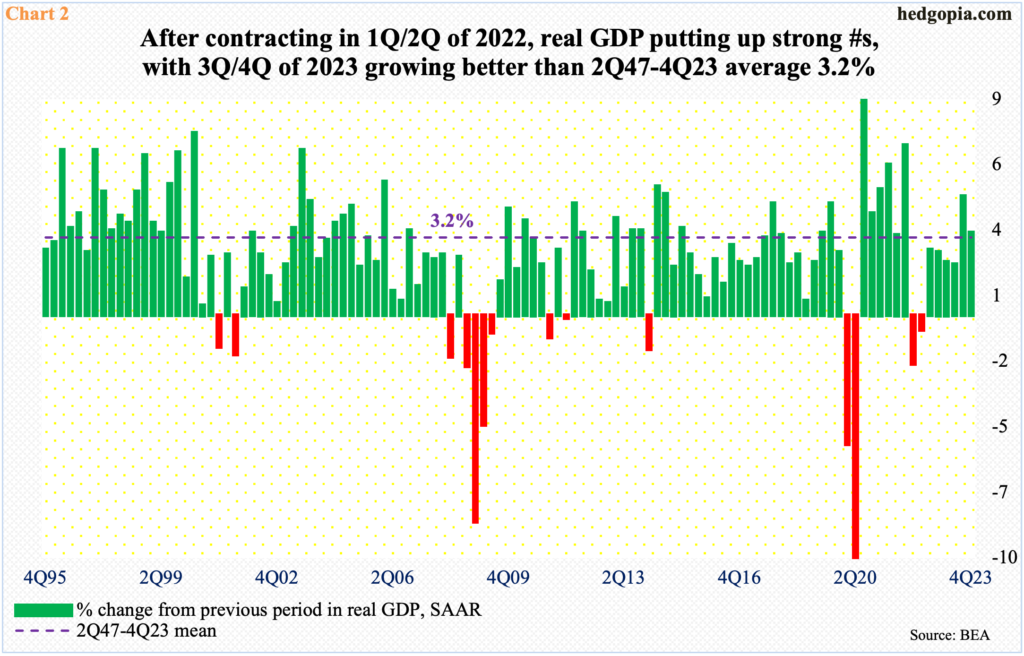
Between March 2022 and July 2023, the Federal Reserve raised the fed funds rate from a range of zero to 25 basis points to between 525 basis points and 550 basis points. Despite this 525-basis-point tightening, the economy continues to hang in there.
In the fourth quarter last year, real GDP grew 3.4 percent, which represents a sixth consecutive quarter of growth – all north of two percent (Chart 2). The Atlanta Fed’s GDPNow model forecasts growth of 2.5 percent in the just-concluded March quarter.
In March, the unemployment rate printed 3.8 percent, with the metric under four percent since February 2022. A much-better-than-expected 303,000 non-farm jobs were created last month, for an average so far this year of 276,000, versus a monthly average of 251,000 last year.
It is too soon to declare but there are incipient signs the economy is reaccelerating. This justifies the latest jump in the 10-year yield. The question is of sustainability. It is possible the effect of the 16-month tightening is still being filtered through the economy. If so, bond bulls (on price) may very well use this as an opportunity to go long the long end of the curve. Should things evolve this way and yields come under pressure, this could help form the right shoulder of a potentially bearish head-and-shoulders formation in Chart 1, with the neckline at 3.20s.
This is a near- to mid-term scenario. Longer-term, there is always a possibility that the market begins to focus on the unsustainable fiscal path the government is on.
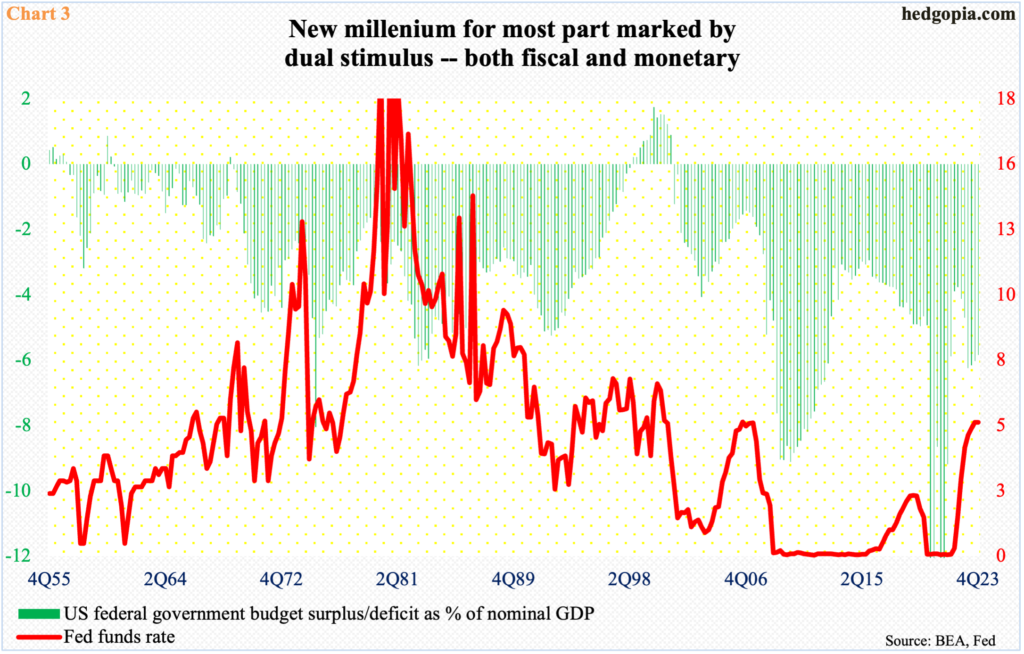
The third millennium – the current one – has pretty much been marked by a constant flow of liquidity – both fiscal and monetary. The last time the US government ran a surplus was in 2001 and the last time the fed funds rate had a six handle was 2000 (Chart 3).
In 4Q23, the government’s budget deficit as a percent of nominal GDP was 5.8 percent. This at a time when the economy is growing at a nice pace.
This comes with a cost.
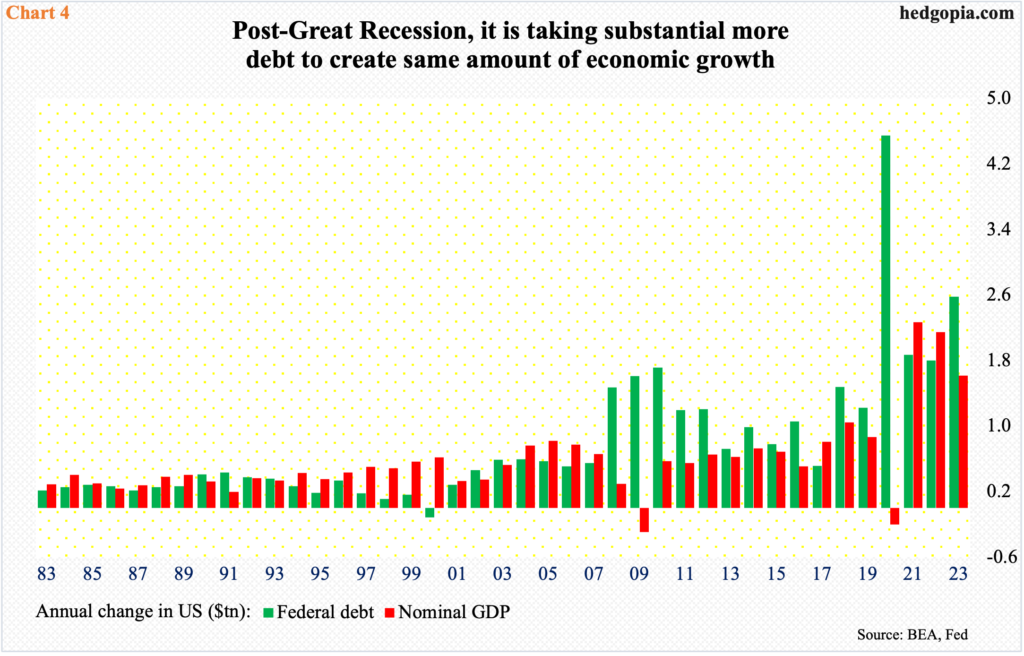
At the end of 2023, federal debt was $34 trillion, which has now grown to $34.6 trillion. The debt load has quadrupled since 2007 and doubled in the last decade. Debt is being accumulated at a reckless manner.
Chart 4 tallies the annual change in federal debt and nominal GDP. Up until the Great Recession, the relationship was positive, with debt contributing decently to the GDP. Then, things flipped. There have been several years in which the economy has grown less than debt did. In 2023, federal debt expanded by $2.5 trillion and nominal GDP by $1.6 trillion.
In other words, it is taking more and more debt to produce the same amount of output.
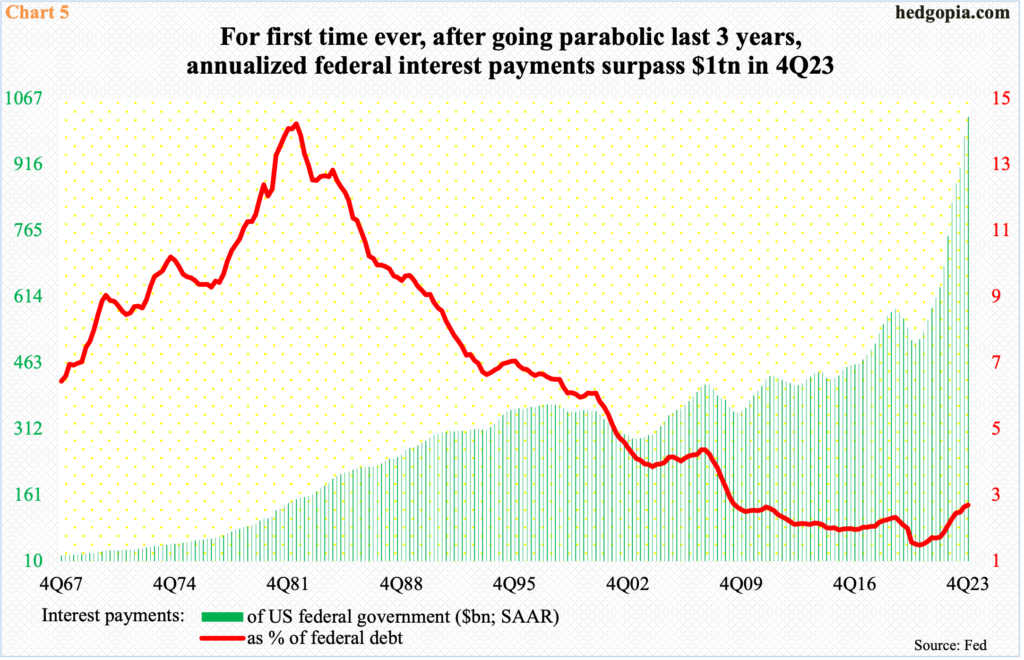
Concurrently, interest payments are breaking the back of the federal government. In 4Q23, for the first time ever, annualized interest payments exceeded $1 trillion (Chart 5). This has just about doubled in three years. Back then, rates were ultra-low. Interest payments as a percent of federal debt equaled 1.87 percent in 4Q20, versus 3.02 percent in 4Q23.
This is one reason why the Fed can least afford to keep rates very high for too long. There are no signs of meaningful reduction in the deficit, let alone turn into surplus. The only antidote to continued increase in the debt load is to have lower rates so interest payments do not go through the roof. This game will only work so long as the markets allow it. So far, bond vigilantes are not panicking. One sign they are beginning to do so will be reflected in the 10-year rallying aggressively toward five percent and through it eventually. A lack thereof only means the can got kicked down the road – again. In this scenario, bond bulls could very well be itching to go long treasuries.
Thanks for reading!

