Major US equity indices experienced a gap-up breakout on November 6, after it became apparent that the presidential election from the previous day was won by Donald Trump. Last week, those breakouts were successfully retested.

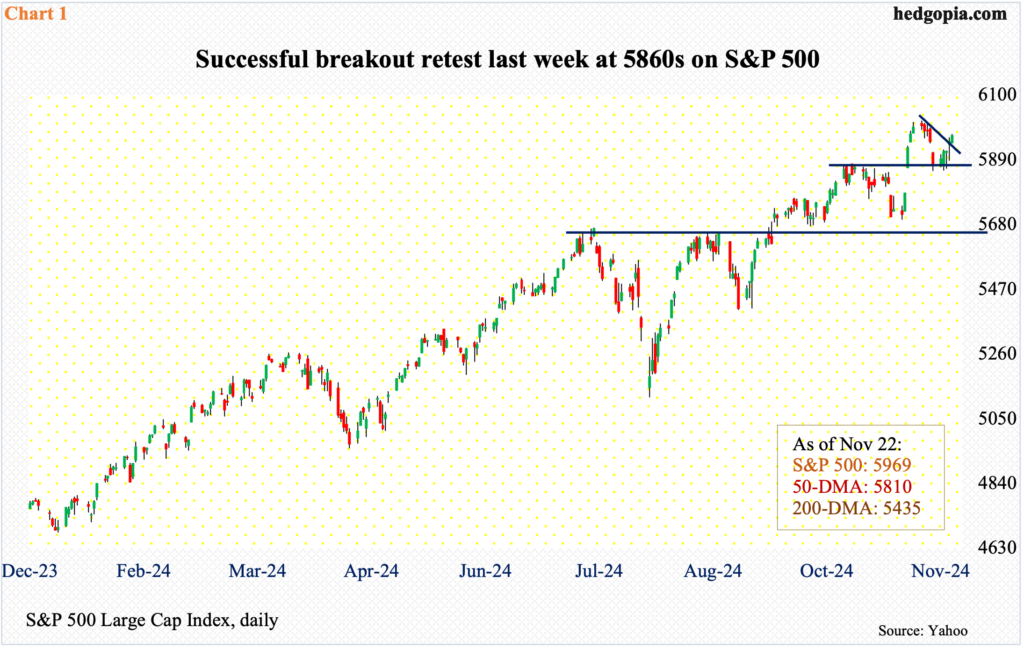
On the 6th, the S&P 500 gapped up 2.5 percent, pushing through horizontal resistance at 5860s going back to mid-October.
By the 11th, the large cap index went on to post a new intraday high of 6017 before sellers showed up. Subsequently, six sessions ago on Friday, it ticked 5853 intraday, where the 50-day moving average lied. This was also a test of 5860s, which until the breakout on the 6th stopped the bulls from mid-October. The level continued to attract bids in the first three sessions last week (Chart 1). By the end of the week, the index was up 1.7 percent to 5969.
The post-election high is now 48 points away. This level can now act as a magnet, although it remains to be seen if a new high will print in the sessions ahead. For nitpickers, the RSI continues to diverge from the price.

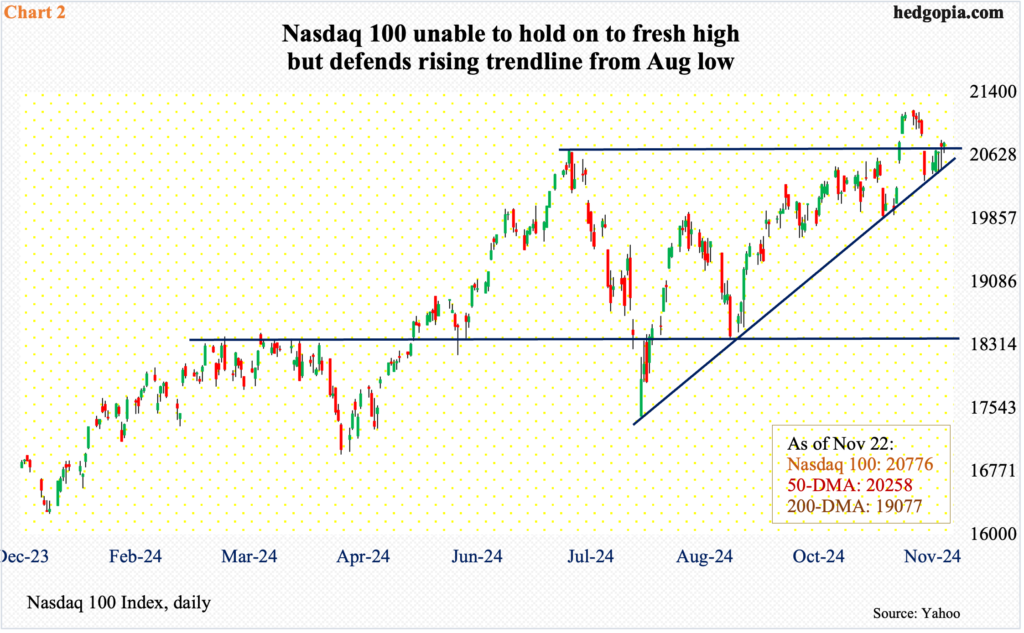
Things evolved similarly on the tech-heavy Nasdaq 100, which on the 6th surpassed the prior high of 20691 from July 10. The index then went on to establish a new intraday high of 21182 on the 11th. The downward pressure that followed stopped at 20315 on the 15th; this is where a rising trendline from August 5 lied, and tech bulls continued to defend the support in the next four sessions – that is, the first four sessions last week (Chart 2). When it was all said and done, the index added 1.9 percent last week to 20776, past the July high, albeit by just a little.
The all-time high from the 11th is two percent away and is within reach. As is the case with the S&P 500, momentum could be performing a lot better on the Nasdaq 100.

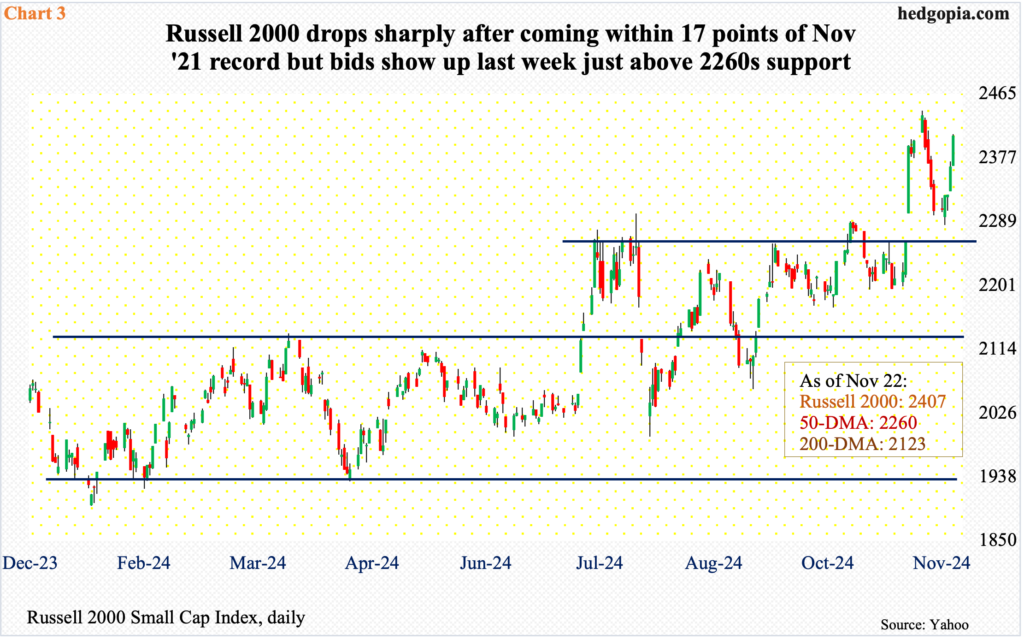
Speaking of which the daily RSI on the Russell 2000 turned up at the median last Monday. Leading up to that, the small cap index on the 11th came within 17 points of its all-time high (2459) from November 2021 and retreated. Last Tuesday, it ticked 2284 intraday and rallied. This was essentially a retest of 2260s which held firm from mid-July until it gave away on the 6th (Chart 3). After bids started coming in on Tuesday, the week jumped 4.5 percent to 2407.
The prior high from three years ago is now 2.2 percent away. Before the level is attacked, small-cap bulls first need to take care of 2442, which was the high reached on the 11th.

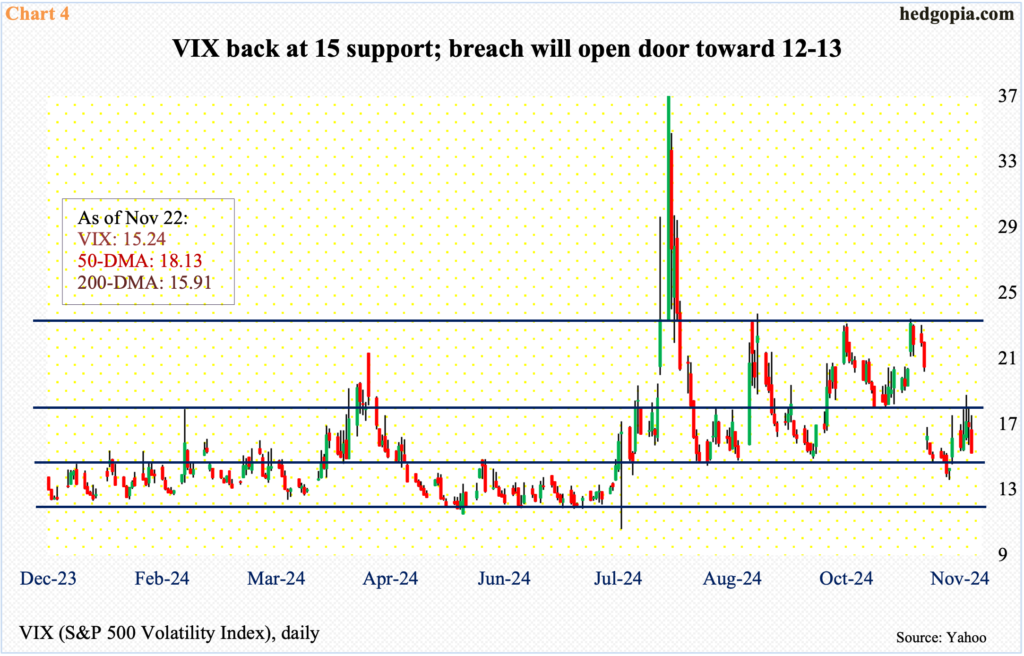
Amidst all this, VIX is back at 15, closing last week down 0.90 points to 15.24. This is an opportunity for volatility bears to take out this support and push the index toward 12-13, which was last tested four months ago (Chart 4).
After VIX tumbled on the 6th, as equities surged, volatility bears did indeed capture 15 in the subsequent sessions, but the downward pressure ended on the 14th at 13.59. The rally that followed petered out at 18.79 last Wednesday. This has now opened up another opportunity to decisively penetrate 15 and test 12-13.
Importantly, on Wednesday when VIX hit 18.79 and headed lower, the daily RSI (41.86) was rejected at the median. The last time this metric hit sub-30 was two years ago. Fingers crossed for volatility bears/equity bulls!
Thanks for reading!

