
An interest-rate hike next month is looking like a certainty. Warsh’s hawkish posture on inflation, which has remained above the Fed’s target for more than five years, comes at a time when corporate profit growth is at an unsustainable level. For the most part, the major equity indices are yet to reflect that.
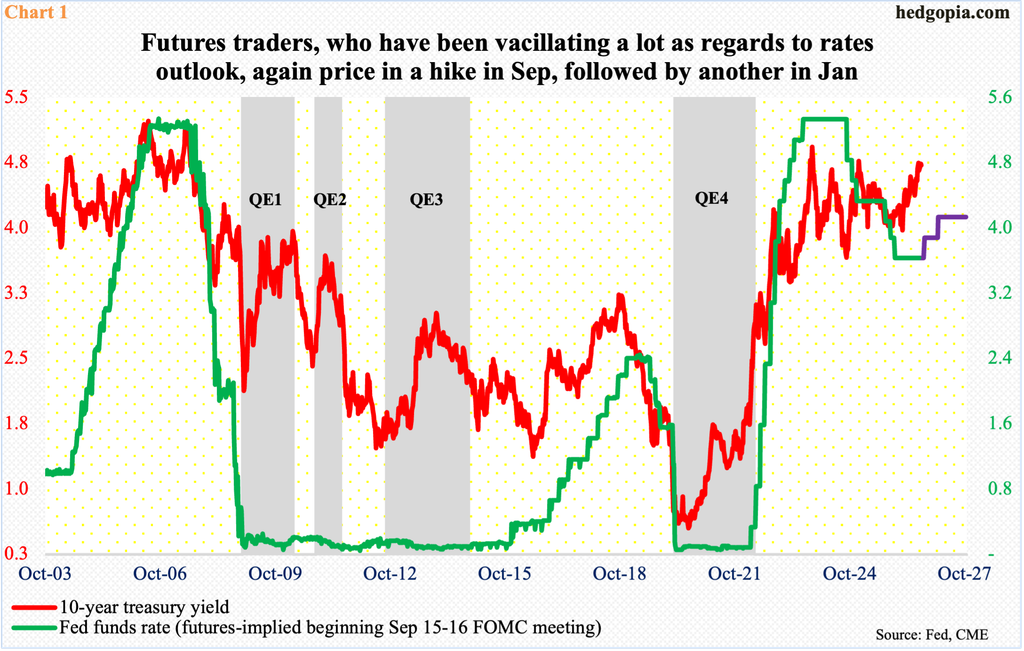
A September hike is looking increasingly likely. The CME’s FedWatch tool shows with 63 percent probabilities that the fed funds rate will be raised by a quarter point in next month’s FOMC (Federal Open Market Committee) meeting (15-16).
The benchmark rates have been left unchanged since last December when they were reduced by 25 basis points; this preceded a cut of similar magnitude in September and October. Earlier, rates reached a cycle high 5.25 percent to 5.50 percent in July 2023, followed by cumulative cuts of 100 basis points over three meetings in 2024.
Futures traders changed their rates outlook following Federal Reserve Chairman Kevin Warsh’s 10AM keynote speech at the Jackson Hole Symposium last Friday. On Thursday, the odds of a hike next month were 35 percent. Newly appointed Warsh, who assumed office on May 22, had been warning about persistently high inflation since he took over, but this was the first time he sounded very sure. “While this summer’s readings were better than expected, they do not tell me that underlying trends have meaningfully improved,” Warsh said of inflation.
After next month’s hike, traders are now betting on one more 25-basis-point increase in January (Chart 1). The 10-year treasury yield, at 4.72 percent, has been trying to lead the Fed, rallying from 3.96 percent six months ago.
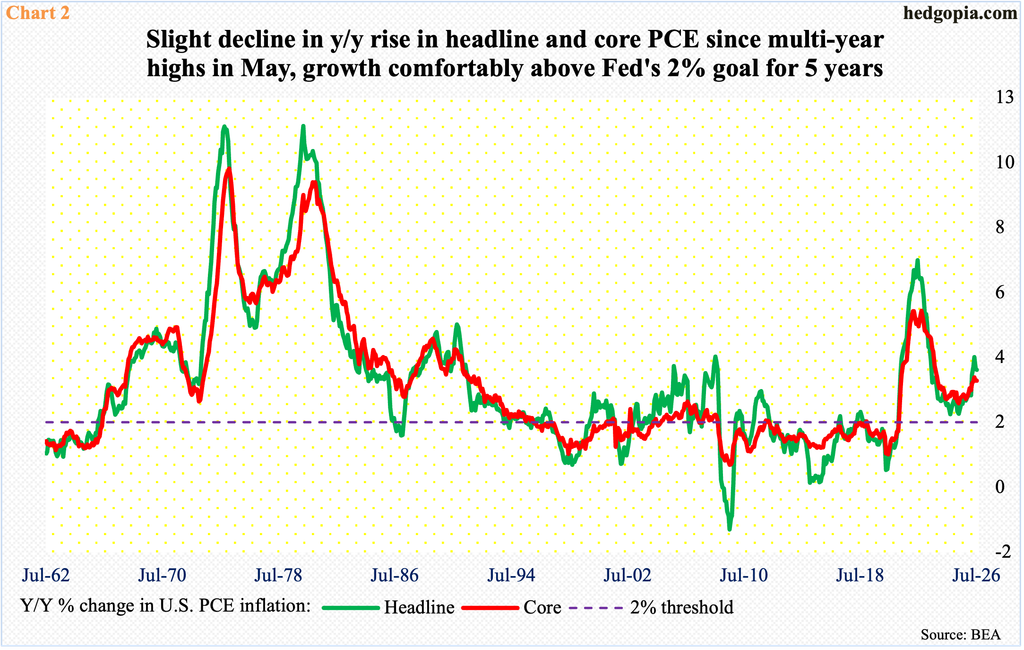
It will now take a substantially weaker reading of August’s consumer price index, due out on the 11th, for the FOMC to stand pat next month. In the 12 months to July, headline and core CPI respectively increased 3.36 percent and 2.48 percent, with each setting four-month lows. This measure of inflation has persisted over the central bank’s stated goal of two percent for over five years now. This also holds true for PCE (personal consumption expenditures), which is the Fed’s favorite.
From a year ago in July, headline and core PCE rose 3.70 percent and 3.34 percent, in that order; May’s 4.11 percent and 3.46 percent set 37- and 31-month highs respectively. PCE inflation is nowhere near the cycle highs of 2022 when they respectively peaked at 7.24 percent (June) and 5.60 percent (February), but they regained strength after dropping to 2.28 percent and 2.61 percent by April last year (Chart 2). August’s PCE will be reported on the 30th next month, so the FOMC only has August’s CPI to act on.
Apart from his hawkish stance on inflation, Warsh also spoke very highly of the strength of the U.S. economy. It shows in the numbers.
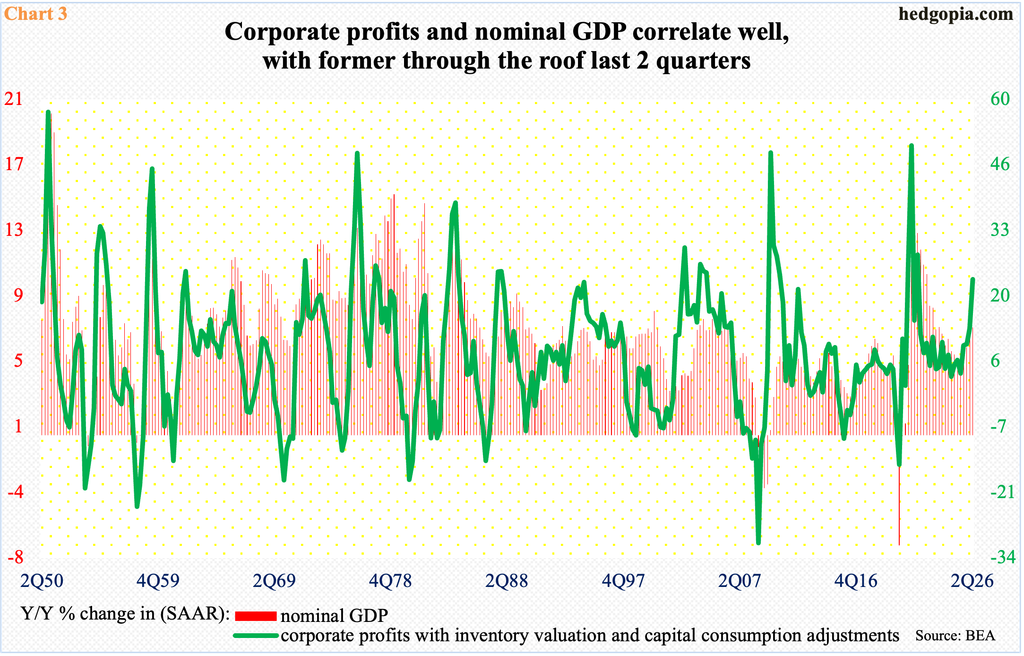
In the June quarter, nominal GDP grew at an annualized rate of eight percent to $32.5 trillion. This is up 6.6 percent from $30.5 trillion a year ago. Corporate profits are faring even better – much better, as a matter of fact.
Corporate profits with inventory valuation and capital consumption adjustments hit a record $4.8 trillion in 2Q26 (seasonally adjusted annual rate), surging 22.8 percent from $3.9 trillion a year ago (Chart 3). This represents the steepest year-over-year growth rate in 18 quarters, with growth rate having accelerated in the last two quarters.
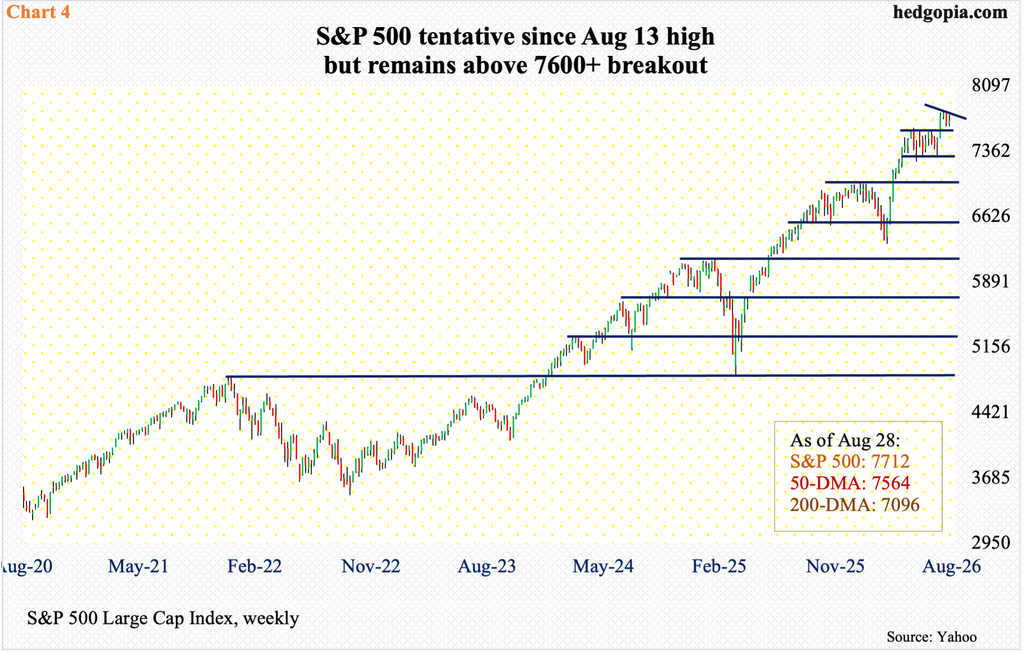
The massive profit growth is the primary reason why equity bulls are staying put, but the truth remains that this kind of growth is simply unsustainable, which is not yet reflected in the S&P 500.
The large cap index posted a new intraday high of 7817 on the 13th this month. Through that high, the index jumped 23.7 percent from the March 30 intraday low of 6317. At last Friday’s intraday high of 7771, bulls were merely 0.6 percent from that high, although they failed to keep the session’s gains, closing at 7712, still up 0.5 percent for the week. This was the third up week in four, yet the index has had two weeks of lower highs since reaching the all-time high on the 13th (Chart 4).
Nevertheless, bulls can take solace in the fact that they have so far managed to defend breakout retest at 7600-plus. The S&P 500 consolidated for a couple of months after tagging 7621 on June 2, which was then eclipsed on the 4th this month. Last Monday’s intraday low of 7638 matched the low of 7639 two sessions before that.
Concurrently, the daily Bollinger bands have once again tightened. If past is prelude, when this happens, a sharp move follows – either up or down. In late July, the bands similarly tightened, and the suppressed energy was released in an upside breakout past 7621 early this month. Were the bears to prevail this time, they first need to take control of 7600-plus; the 50-day moving average at 7564 follows. The weekly seems to want to trade lower.
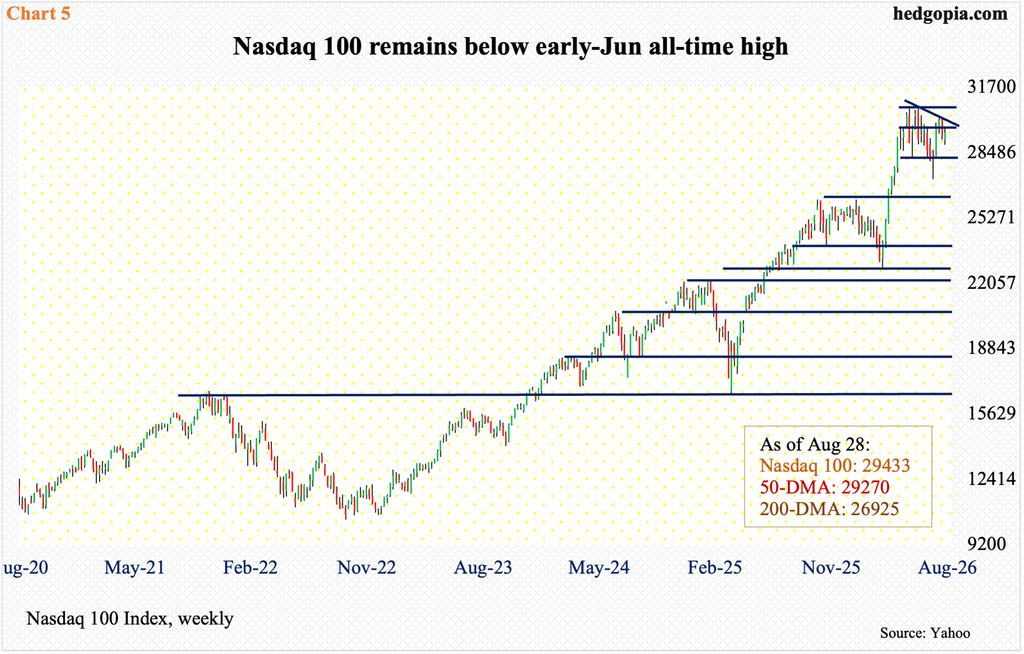
Unlike the S&P 500 that seems oblivion of the impending deceleration in earnings growth, the Nasdaq 100 arguably is beginning to price it in. The tech-heavy index continues to remain under the June 3 all-time high of 30762; other major indices like the S&P 500 and Russell 2000 posted fresh highs this month.
Last week, the Nasdaq 100 rose 0.4 percent to 29433, with an intraday high of 29753 tagged on Friday, which was yet another lower high since the June 3 peak. The Friday high also lined up with three-and-a-half-month horizontal resistance at 29700s (Chart 5). Right below rests the 50-day at 29270; once it gives way, there is horizontal support at 28600s and then 28200s.
As is the case with the S&P 500, the daily Bollinger bands have tightened significantly.
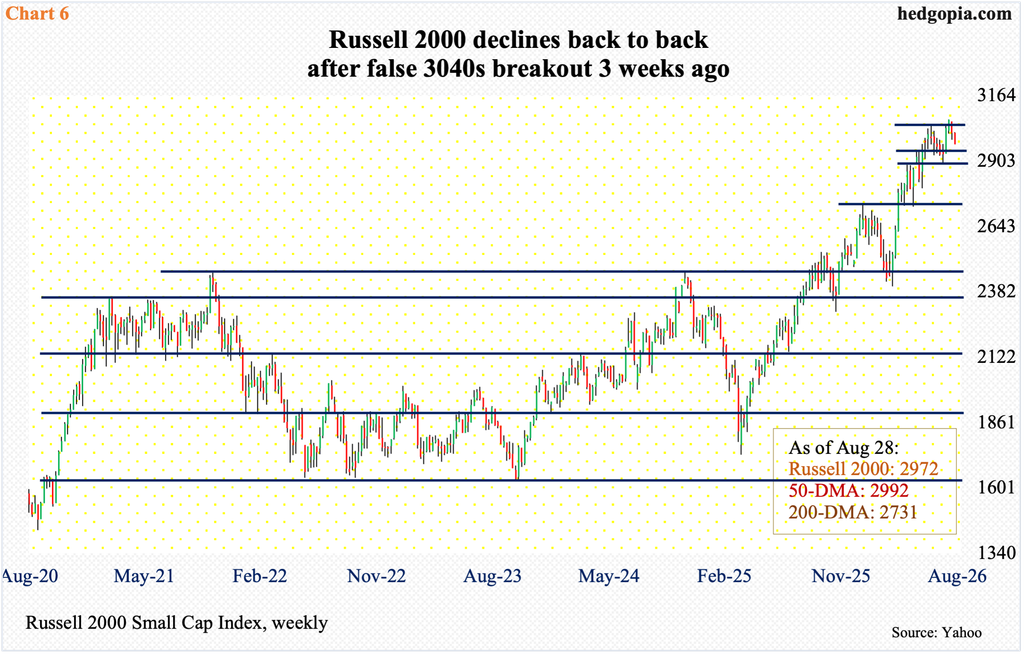
Speaking of which, the bands have also narrowed quite a bit on the Russell 2000, which took a big hit last Friday fearing higher rates, losing 1.4 percent. For the week, the small cap index dropped 1.5 percent to 2972.
Small-caps inherently have a large exposure to the domestic economy versus their mid- and large-cap peers which also have international exposure. Small-caps also tend to be leveraged, with more exposure to the short end of the yield curve.
Last week’s drop was the second straight down week, following a false breakout three weeks ago at 3040s (Chart 6). On the 14th, the Russell 2000 ticked 3070, after having broken out of 3040s a session before that. The index earlier hit 3047 on July 1, 3049 on the 5th and 3049 again on the 18th this month.
Friday’s drop also cost the Russell 2000 the 50-day at 2992, probably opening the door to a test of 2940s, followed by 2880s.
Thanks for reading!
